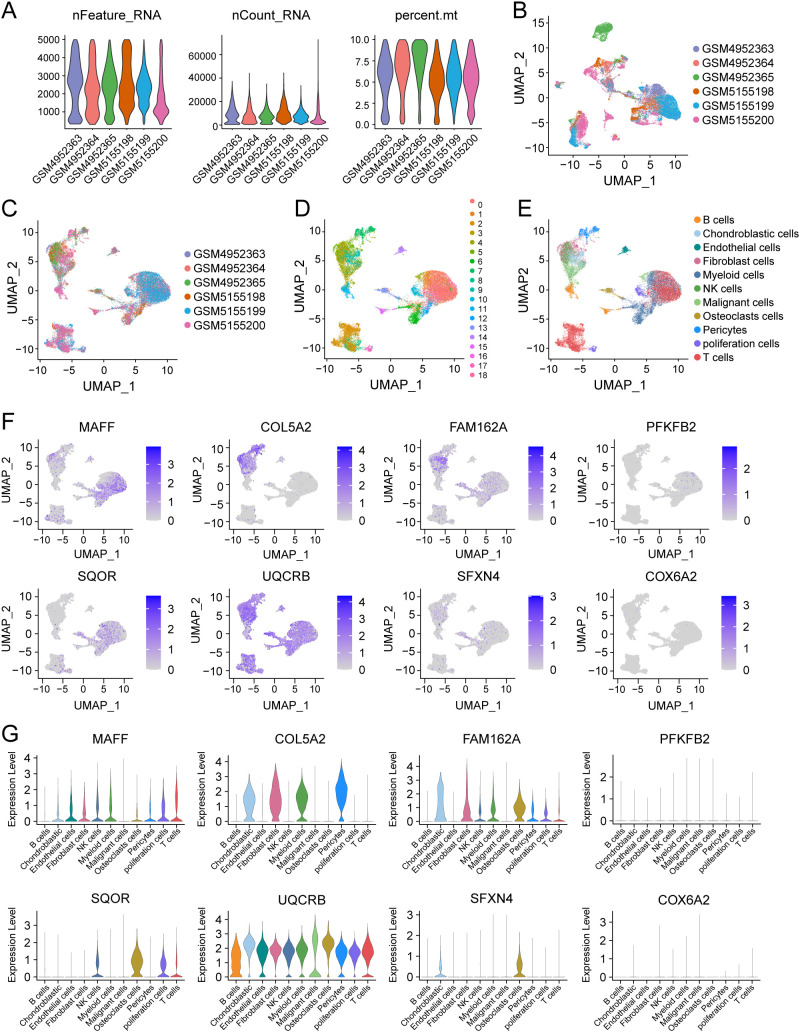
Figure 9.
Single-cell analysis of 8 model genes in the GSE162454 dataset. (A–C) Quality control and de-batching effect of the single-cell sequencing raw data. (D) The UMAP plot of 30,660 cells colored by the 19 clusters. (E) The UMAP plot of 30,660 cells colored by 11 different cell subtypes. (F, G) The expression of 8 modeled genes across various cell subtypes.

