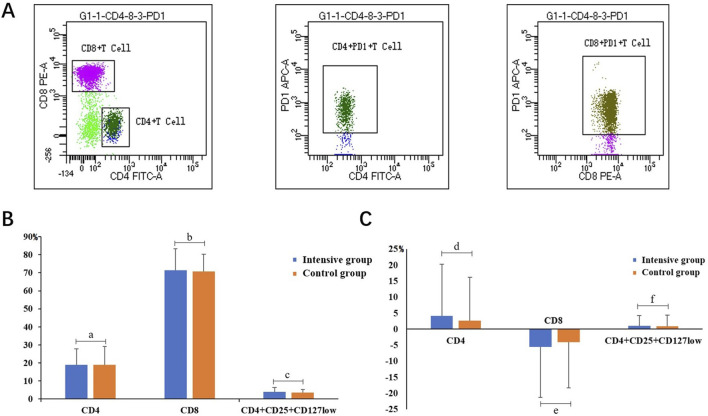
FIGURE 1.
(A) Representative graph of CD4 and CD8 cell proportions measured by flow cytometry. (B) Comparison of the proportion of CD4, CD8, and CD4+CD25+CD127low between the two groups at baseline. (C) Comparison of proportion difference of CD4, CD8, and CD4+CD25+CD127low from baseline after 24 weeks; a t = −0.02, p = 0.9840; b t = 0.22, p = 0.8282; c t = 0.69, p = 0.4955; d Z = 0.1723, p < 0.0001; e Z = 0.7024, p < 0.0001; f Z = 0.0356, p < 0.0001.

