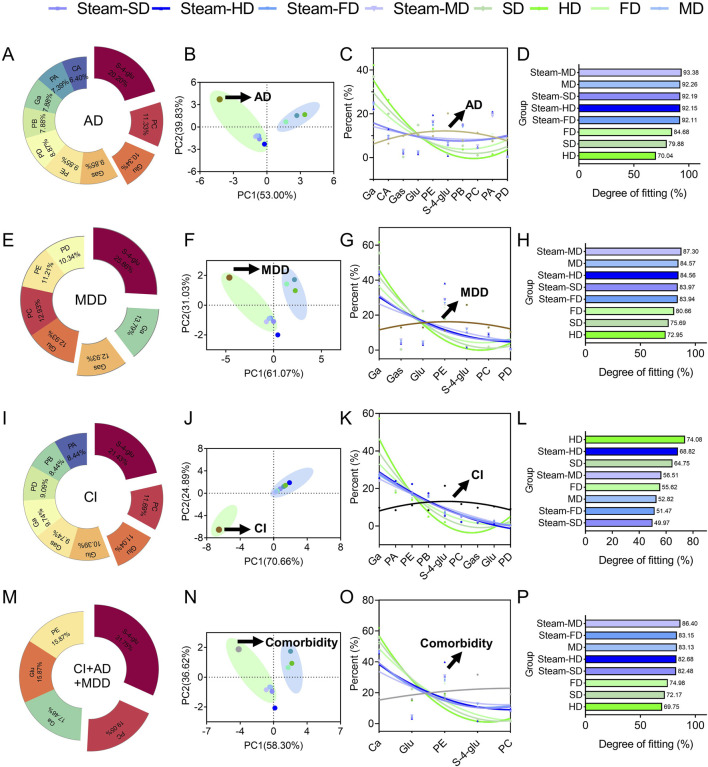
FIGURE 9.
Analysis of fit degree. In silico predictions of the optimal processing protocols to prepare GR against (A–D) Alzheimer’s disease, (E–H) major depressive disorder, (I–L) cerebral ischemia, or (M–P) all three conditions simultaneously. In each row, the first panel shows the contributions of the individual quality markers to the total degree of the network of interactions among the quality markers and potential protein targets; the second panel shows the results of principal component analysis to detect the clusters of processing protocols; the third panel shows the fitting curve; the fourth panel shows the fitting degree assigned to each protocol.

