Figure 2.
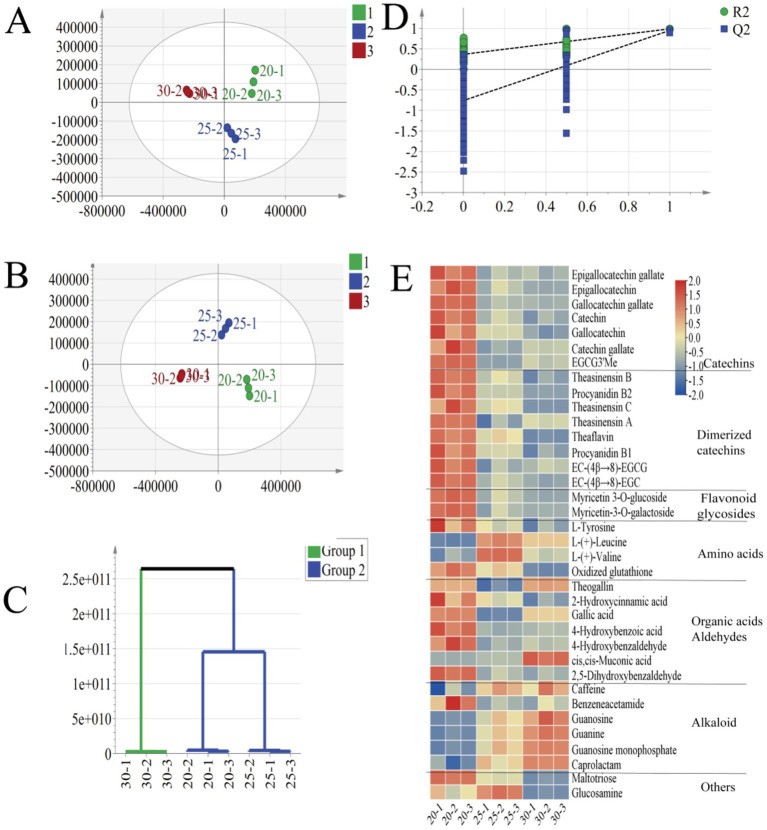
Plots of PCA scores (A) and OPLS-DA scores (B) of three black teas at different fermentation temperatures; results of HCA analysis of the OPLS-DA model (C); cross-validation plots obtained from 200 perturbation tests (D); and heatmap analysis of 36 differential compounds after normalization (E).

