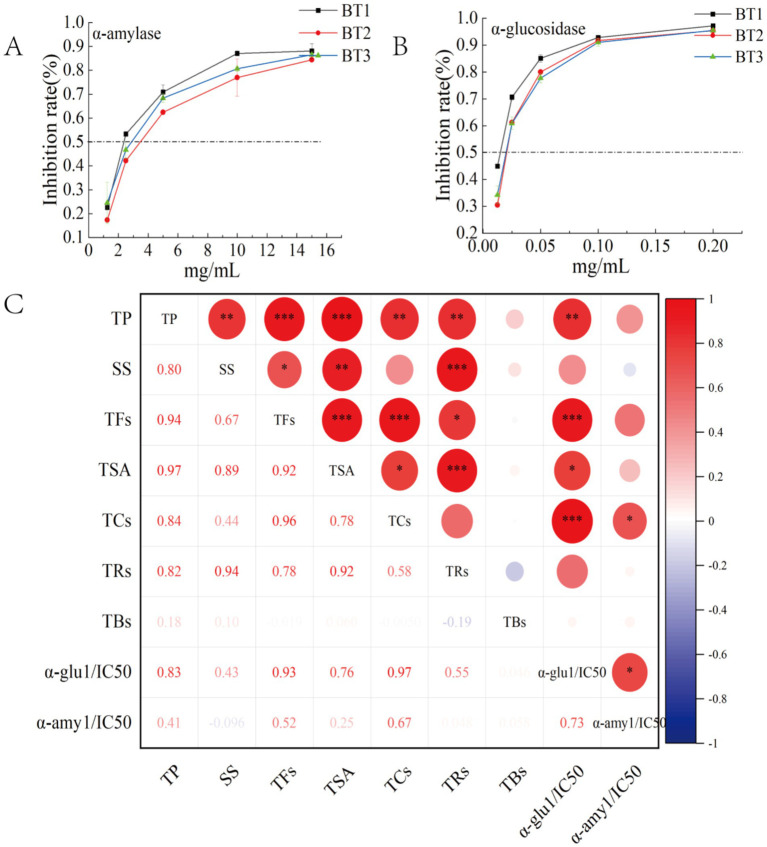
Figure 3.
Heat map of Pearson ‘s correlation analysis of α-amylase (A), α-glucosidase inhibitory activity (B), and digestive enzyme inhibitory activity with the main constituents of black tea at different fermentation temperatures (C); BT1, BT2, and BT3 denote the fermentation temperatures of 20, 25, and 30°C, respectively; *p < 0.05, **p < 0.01 and ***p < 0.001. TCs, total catechins.

