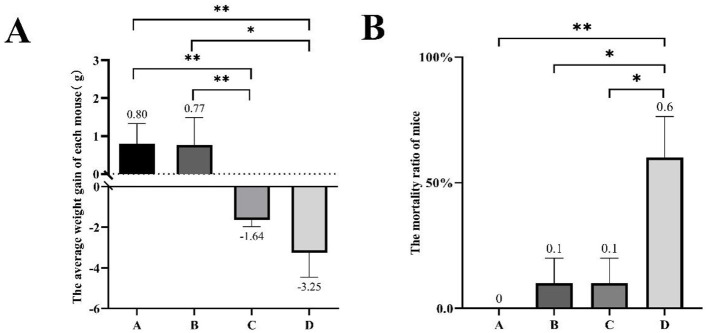
Figure 1.
The body weight progression and mortality of mice under different H2O2 treatments in 1 week. (A) The average weight gain of every mouse in different groups. (B)The mortality ratio of mice in the different treatment groups. Group A was injected with 0.9% saline as the control; group B was injected with 0.75% H2O2 solution; group C was injected with 1.5% H2O2 solution; group D was injected with 3.0% H2O2 solution. Bars represent mean ± SEM. The asterisks indicated statistically significant differences, * represented P < 0.05 and ** represented P < 0.01.

