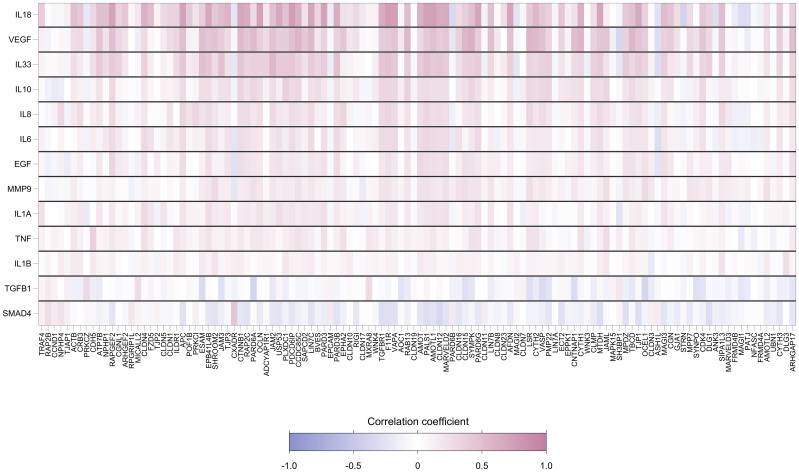
Figure 5.
Heatmap showing pairwise correlation coefficients between expression levels of 118 foreskin tight junctions and 13 cytokine genes. Each row represents a gene encoding cytokine, and each column represents a TJ gene. Spearman’s correlation coefficient was calculated for each row-column pair. Darker red values indicate higher positive correlation while darker blue values indicate higher negative correlation, as shown in the legend.

