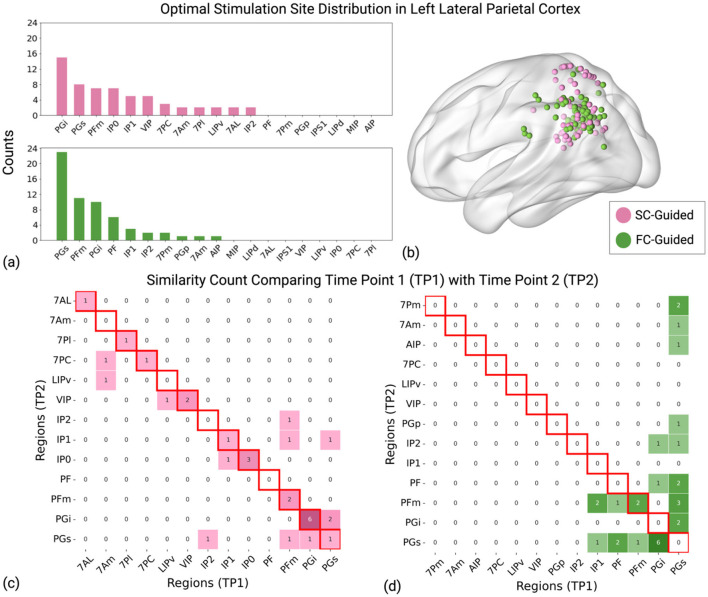
Figure 3.
Distribution of identified stimulation sites in the left lateral parietal cortex. (a) The y-axis “Counts” indicates the total occurrences of stimulation sites within each strategy (SC-Guided and FC-Guided) across two timepoints in 30 participants (Total 60 occurrences for each strategy). Pink bars denote the SC-guided strategy, and green bars represent the FC-guided strategy. (b) Representation of calculated stimulation sites between the two strategies, plotted for all 30 subjects at both timepoints in MNI standard space. (c) The matrix represents the count of similarity of identified brain regions between time point 1 (TP1) and time point 2 (TP2) using SC-guided strategy. (d) The matrix displays similarity counts for brain regions identified using the FC-guided strategy. Diagonal cells with red borders signify consistent stimulation targets that remain within the same subregion at both time points. A larger number along the diagonal suggests enhanced reliability over time, underscoring the stability of the SC-guided strategy. Pink indicates the SC-Guided strategy, and green indicates the FC-Guided strategy.

