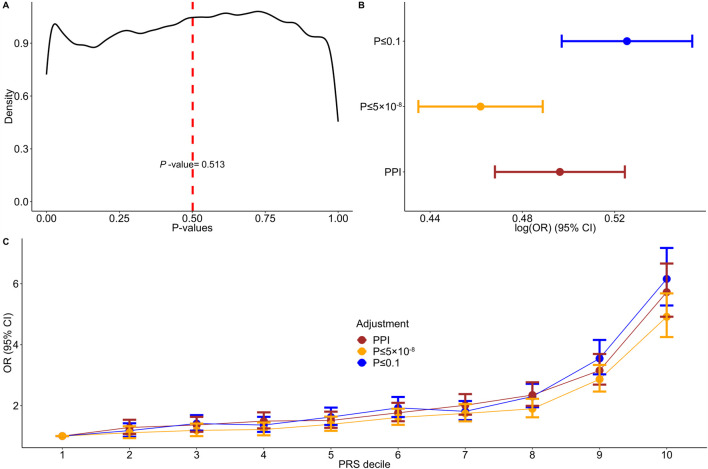
FIGURE 2.
Associations between adjusted polygenic risk scores and psoriasis. (A) Kernel density plot of the variants’ p-values incorporated into the PPI model. (B) Forest plot showing the log (odds ratios) (log (OR)) and 95% confidence intervals (95% CIs) comparing the protein-protein interactions (PPI) model to p-value ≤ 0.1 and p-value ≤ 5 × 10⁻⁸ thresholding models. (C) Discriminative performance of our major polygenic risk score (PRS) models summarized according to OR. Estimated ORs and 95% CIs within each decile were estimated from logistic regression.

