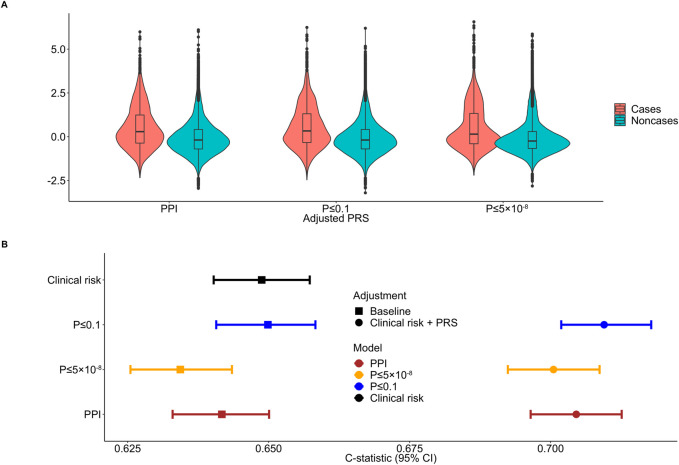
FIGURE 3.
Distribution and discriminative ability of the clinical risk model, adjusted polygenic risk scores (PRSs) and the combined approach for psoriasis. (A) Standardized PRS distributions across the three primary models between psoriasis cases and noncases. (B) Forest plot showing the c-statistic and corresponding 95% confidence intervals (95% CIs) comparing the protein-protein interactions (PPI) model to conventional clinical risk model, p-value ≤ 0.1 and p-value ≤ 5 × 10⁻⁸ thresholding models and the combined approach. The clinical risk model includes age, sex, body mass index (BMI) and smoking status. Discrete color scales were used to discriminate between models. Discrete shape scales were used to discriminate between baseline and combined approaches.

