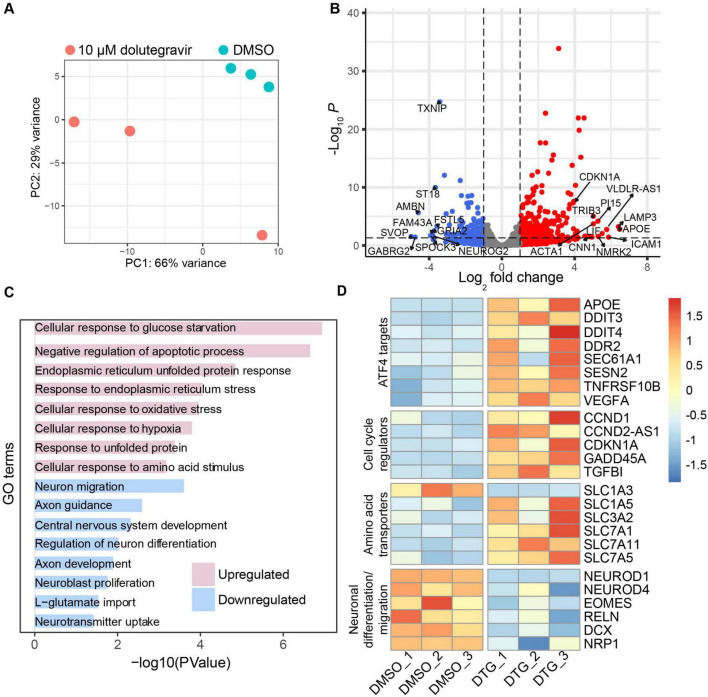
FIGURE 2.
RNA-seq reveals upregulation of stress-related genes and downregulation of neurogenesis-related genes. (A) Principal components analysis (PCA) plot of bulk RNA-seq data from organoids treated with DMSO or 10.0 μM DTG for 12 days and analyzed at Day 20 (C1-2 cell line, three replicates for each condition) showing variability within and across conditions. The plot was generated using the “plotPCA” function embedded in the DESeq2 package. (B) Volcano plot showing downregulated (blue) and upregulated (red) genes. Differential gene expression analysis based on a model using negative binomial distribution, DESeq2 with Benjamini-Hochberg correction. The top 10 downregulated and upregulated genes, as well as CDKN1A, are labeled. (C) Functional enrichment analysis showing select upregulated and downregulated gene sets using DAVID (Sherman et al., 2022). (D) Heat map, generated using the R package “pheatmap”, showing expression levels of genes of interest based on functional properties including gene targets of ATF4, which is an effector of the integrated stress response, cell cycle regulators, amino acid transporters, and genes related to neurodevelopment and migration.

