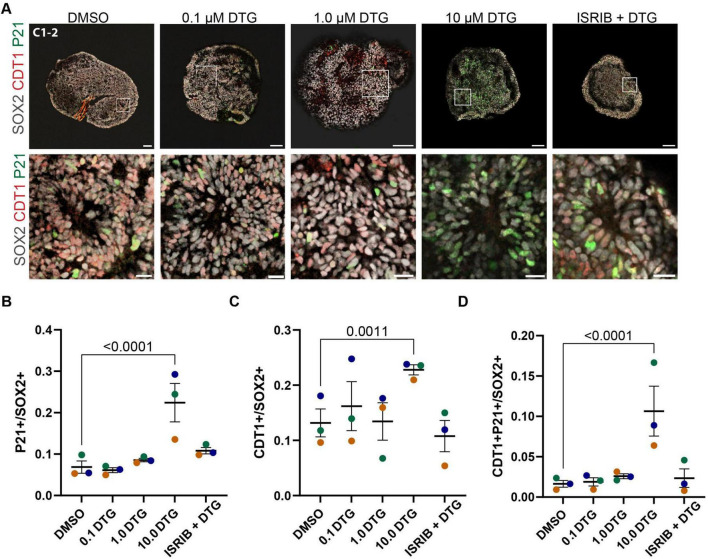
FIGURE 4.
Upregulation of a cell cycle regulator and effector of the integrated stress response. (A) Representative images from the C1-2 line treated with DMSO, 0.1, 1.0, 10.0 μM DTG, or 10.0 μM DTG together with 5 μM ISRIB, an inhibitor of the integrated stress response (top row, scale bars = 100 μm) with magnified view of regions demarcated by white boxes (bottom row, scale bars = 20 μm). (B–D) Quantification of the proportion of P21+ (B), CDT1+ (C), and double-positive P21+CDT1+ cells among SOX2+ marked cells (D). Data points represent marker expression averaged over 3 organoids per line. Marker color represents cell line identity. Main effects of both cell line and drug treatment for CDT1 expression (cell line: F2,38 = 7.251, p = 0.0022; drug treatment: F4,30 = 10.65, p = 0.0002). Main effect of drug treatment for P21+ (F4,38 = 14.78, p < 0.0001) and P21+ CDT1+ (F4,38 = 9.244, p < 0.0001) among SOX2+ cells. Post hoc analyses with Dunnett’s tests for multiple comparisons revealed a higher percentage of P21+, CDT1+, and P21+ CDT1+ among SOX2+ cells with exposure to the highest dose of DTG compared to DMSO-exposed organoids. Adjusted p-values are shown for statistically significant differences among pairwise comparisons. Data shown are means ± SEM.

