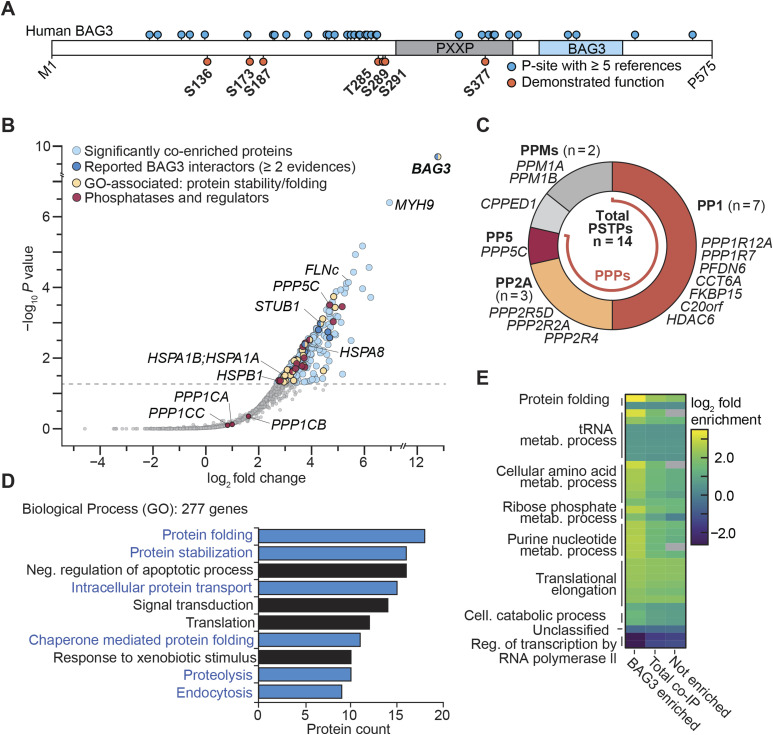
Figure 1. BAG3 is a part of the protein maintenance network involving phosphatases.
(A) Linear illustration of human BAG3 protein sequence with reported p-sites annotated. (B) Co-IP of FLAG-BAG3 from HEK293 cells revealed significantly enriched proteins, assessed using the rankprod method (n = 4), with a minimum fivefold increase and a P-value ≤ 0.05. Enriched proteins in the sample are marked in respective colors for subcategories. Selected hits are annotated with their gene name. A false discovery rate of 5% is indicated by a dashed line. (C) Enriched phosphatases and respective phosphatase regulators from the BAG3 co-IP sample were assigned to their respective (super-)families of human phosphatases. The phosphoprotein phosphatase family is colored; other Ser/Thr-specific phosphatases are in shades of gray. Gene names are listed next to the corresponding assigned phosphatase identifications. PPMs, metal-dependent protein phosphatases; PSTPs, protein serine/threonine-specific phosphatases. (A, D) Gene ontology enrichment analysis of significantly enriched genes from the BAG3 co-IP sample (n = 277) in (A). The 10 most abundant biological process GO terms are displayed as bars, ranked based on protein counts. Biological processes related to BAG3’s role in protein homeostasis are presented in blue. (E) Gene ontology enrichment analysis of the co-IP sample compared with overall human gene expression, displayed as a heatmap. Fold enrichment was calculated for the BAG3 enriched, not enriched, and total co-IP sets, with overall GO categories annotated at the respective cluster. Statistical significance was determined using Fisher’s test (P-value < 0.05) with the Bonferroni correction implemented in the PANTHER database. Non-significant changes are colored gray within the heatmap.

