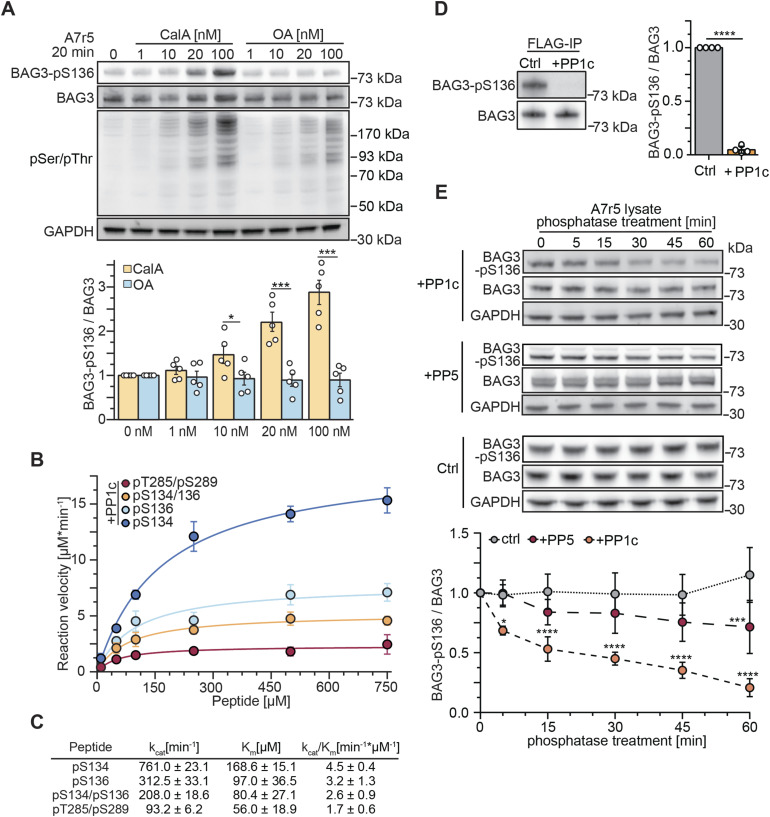
Figure 2. PP1c dephosphorylates BAG3-pS136 in vitro.
(A) A7r5 smooth muscle cells were treated with increasing concentrations of phosphoprotein phosphatase inhibitors CalA or OA as indicated, or DMSO as control. After 20 min of incubation, cells were lysed, and modulator effects on BAG3-pS136 were determined with immunoblots. The quantification is presented as a bar plot, with the mean depicted with error bars that represent the SEM based on five independent experiments. Statistical significance between inhibitors was determined with t test and P-values are displayed as stars (*P = 0.020, ***P < 0.001). (B, C) Michaelis–Menten kinetic parameters of PP1c were determined against the indicated mono- or bisphosphorylated peptides. Error bars represent the SEM of three independent replicates with technical duplicates. kcat/Km was calculated by comparison with a phosphate standard curve. (D) Overexpressed FLAG-BAG3 from transiently transfected HEK293 cells was single-step affinity immobilized with anti-FLAG beads and treated with PP1c for 30 min. Immunoblot quantification depicts the mean of four independent experiments, the error bar represents the SD, with P-values obtained from a t tests (two-tailed, paired, ****P < 0.001). (E) Monitoring of BAG3-pS136 dephosphorylation in A7r5 lysate upon incubation with PP1c, PP5, or without phosphatase as a control treatment for the indicated incubation time. Endogenous phosphatases were inhibited by the addition of 20 nM CalA. Quantification depicts the results of four independent experiments with P-values obtained from two-way ANOVA with Sidak correction (**P = 0.006 [PP1c], **P = 0.005 [PP5], ****P < 0.001). Mean is shown and error bars represent the SEM.
Source data are available for this figure.

