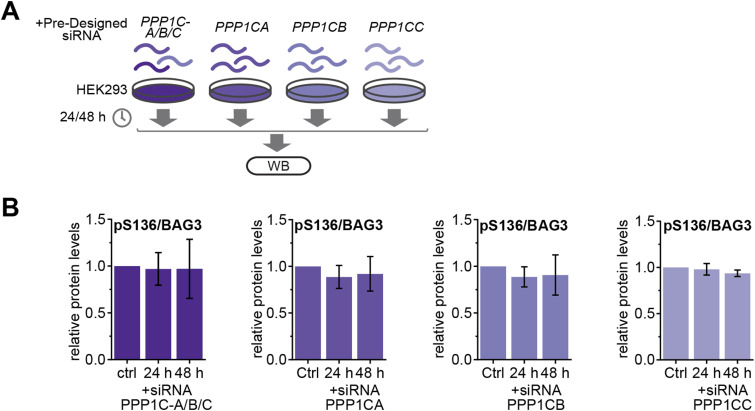
Figure S3. Knockdown of PP1c isoforms in HEK293 cells. (Related to Fig 3).
(A) Schematic illustration of the protein level assessment after treatment of HEK293 cells with pre-designed siRNA. HEK293 cells were transfected with siRNA of PP1 isoforms (PPP1CA/B/C) for 24 and 48 h. (B) Quantification of immunoblotted lysates show phosphorylation level changes of BAG3-pS136 relative to the overall BAG3 levels (n = 3 or 4). Quantification depicts results of three or four independent experiments with P-values obtained from t tests (two-tailed, paired). Error bars represent the SD.
Source data are available for this figure.

