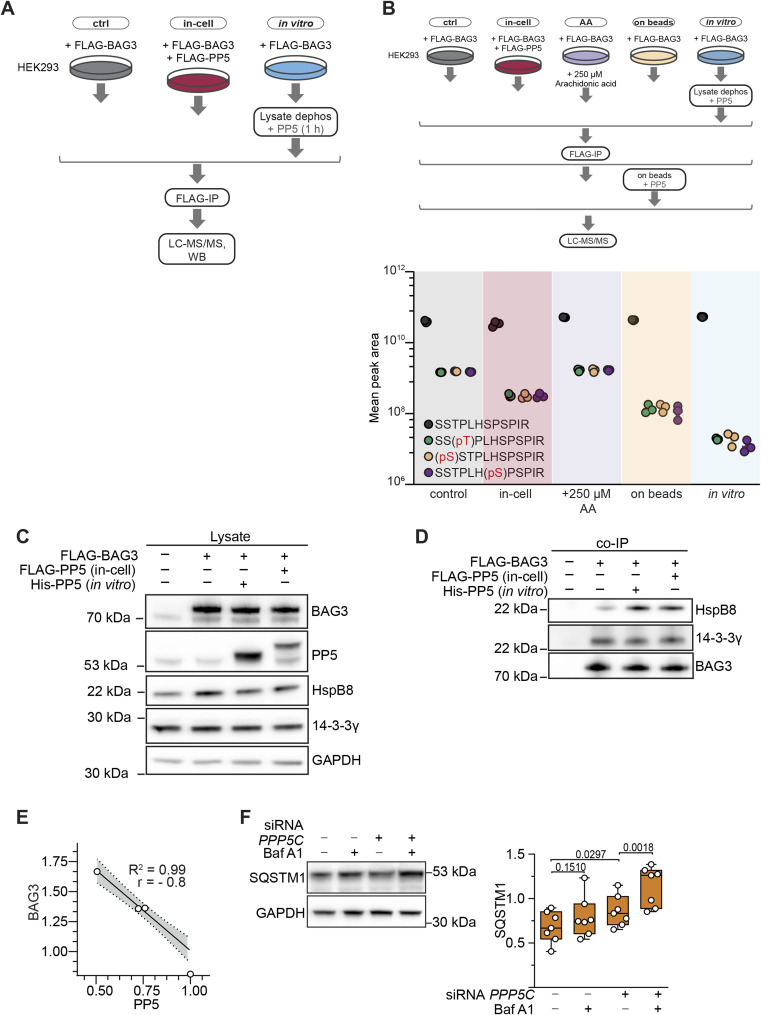
Figure S5. (Related to Fig 5): Supplementary data to PP5 treatments.
(A) Schematic representation of the experimental procedure used for the dephosphorylation analysis of the p-site cluster of FLAG-BAG3 derived from HEK293 cells. Cells were either overexpressing FLAG-PP5 or subjected to in vitro PP5 incubation. This workflow served to decipher the dephosphorylation of the BAG3 p-site cluster (LC-MS/MS; Fig 5A). (B) HEK293 cells overexpressing FLAG-BAG3 were subjected to various modulations of PP5 activity including PP5 co-overexpression for 24 h, activation using arachidonic acid (2 h, 250 μM), or in vitro incubation with recombinant PP5 (1 h, 1 μM, 30°C) in lysate or on-beads (30 min, 1 μM PP5, 30°C). LC-MS/MS was used to quantitatively assess the dephosphorylation status of individual p-sites within the p-site cluster. (C) Related to Fig 5E. Immunoblots of lysates from BAG3-overexpressing HEK293 cells that were treated with PP5 to ensure equal amounts of proteins were present. (D) Related to Fig 5E. Immunoblots of FLAG-BAG3 co-IP samples from HEK293 cells subjected to dephosphorylation treatments with PP5. (E) A7r5 cells were transfected with PPP5C siRNA for the specified incubation time and protein levels were determined using immunoblots. Statistical significance in the changes of protein levels was determined based on data from five independent replicates, and the means are presented as bar plots. The nonparametric Spearman correlation between BAG3 and PP5 upon PPP5C siRNA treatment verifies the negative correlation between the protein levels. (F) Smooth muscle cells were subjected to treatment with control siRNA or PP5-targeting siRNA (siPP5) followed by treatment with BafA1 to inhibit CASA-mediated degradation. Statistical significance of changes in protein levels of SQSTM1 was assessed using data from seven independent replicates, represented as boxplots. P-values were calculated using a two-way ANOVA and analyzed using PRISM/GraphPad version 6.
Source data are available for this figure.

