
Fig. 5. Bar chart with SNP-based genetic correlation of each of the five personality traits with a different psychological disorder/trait or different behaviours plotted.
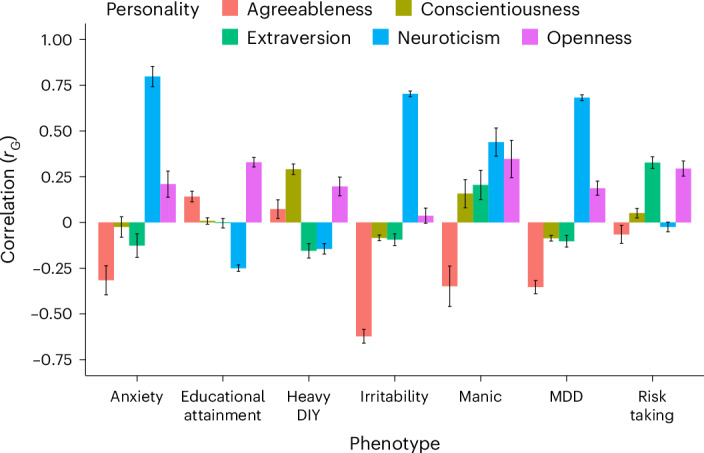
The y axis is the genetic correlation. Error bars (in black) indicate the 95% CIs of the estimated genetic correlation. Anxiety indicates substances taken for anxiety; medication is prescribed for at least 2 weeks. Heavy DIY activities describes the types of physical activity in last 4 weeks; for example, weeding, lawn mowing, carpentry and digging. Manic behaviour describes manic/hyper behaviour for 2 days. Detailed results for all traits, including the sample size of each of the traits, is presented in the Supplementary Tables 16–20.