
Figure 2.
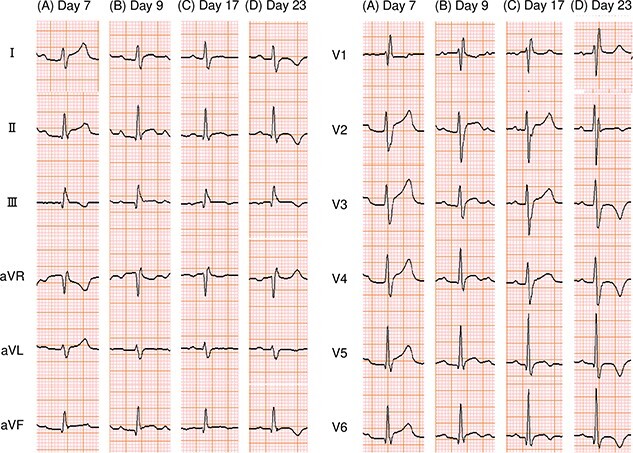
12-lead ECG. PR depression and ST elevation were observed (A and B), then became less noticeable (C), and negative T-waves appeared (D). ECG: electrocardiogram.
Official websites use .gov
A
.gov website belongs to an official
government organization in the United States.
Secure .gov websites use HTTPS
A lock (
) or https:// means you've safely
connected to the .gov website. Share sensitive
information only on official, secure websites.
12-lead ECG. PR depression and ST elevation were observed (A and B), then became less noticeable (C), and negative T-waves appeared (D). ECG: electrocardiogram.