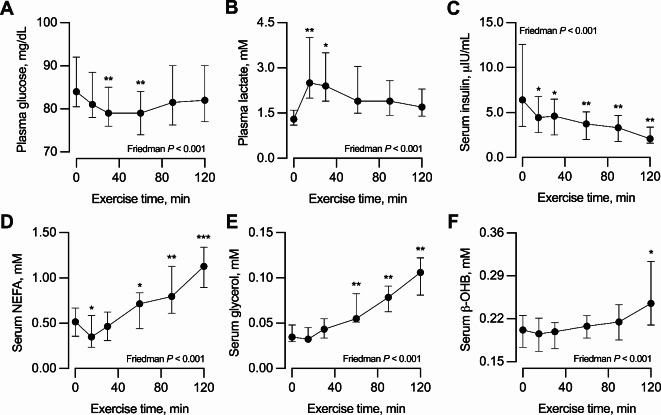
Fig. 1.
Response to exercise of circulating (A) glucose, (B) lactate, (C) insulin, (D) non-esterified fatty acids [NEFA], (E) glycerol, and (F) beta-hydroxybutyrate [ß-OHB]. Data are median with interquartile range. Measurements were conducted before exercise (time 0 min) and at 15, 30, 60, 90, and 120 min of exercise. n = 17, except in time points 90 min [one missing value] and 120 min [two missing values]. The effect of exercise was tested with the Friedman test for repeated measurements; therefore, only the 15 participants with data in all time points were included in the analyses. *P < 0.05, **P < 0.01, ***P < 0.001 vs. time point 0 min (before exercise) for the Sign post-hoc test with Bonferroni adjustment.

