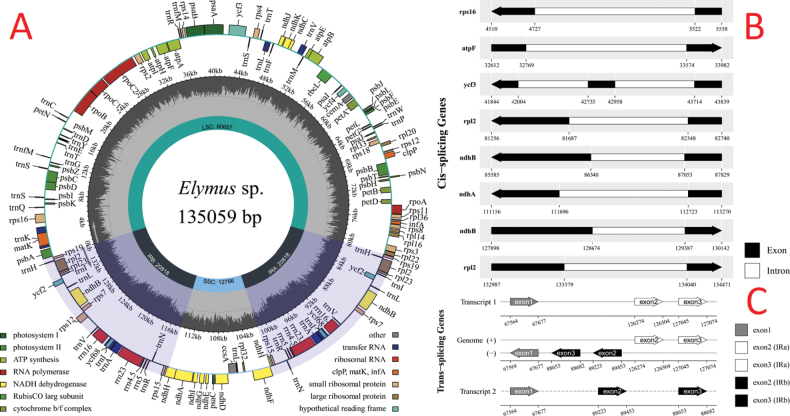
Figure 9.
Schematic circular map of overall features of E.multiramosus chloroplast genome. Graphic showing features of its plastome was generated using CPGview. The map contains three tracks. From the inner circle, the first track depicts the sizes of the inverted repeats (IRa and IRb), small single-copy (SSC) and large single-copy (LSC). The second track plots the distribution of GC contents along the plastome. The third track displays the genes belonging to different functional groups with different coloured boxes. The outer and inner genes are transcribed in the clockwise and counter-clockwise directions, respectively (A). Cis-splicing gene distribution map (B). Trans-splicing gene distribution map (C).

