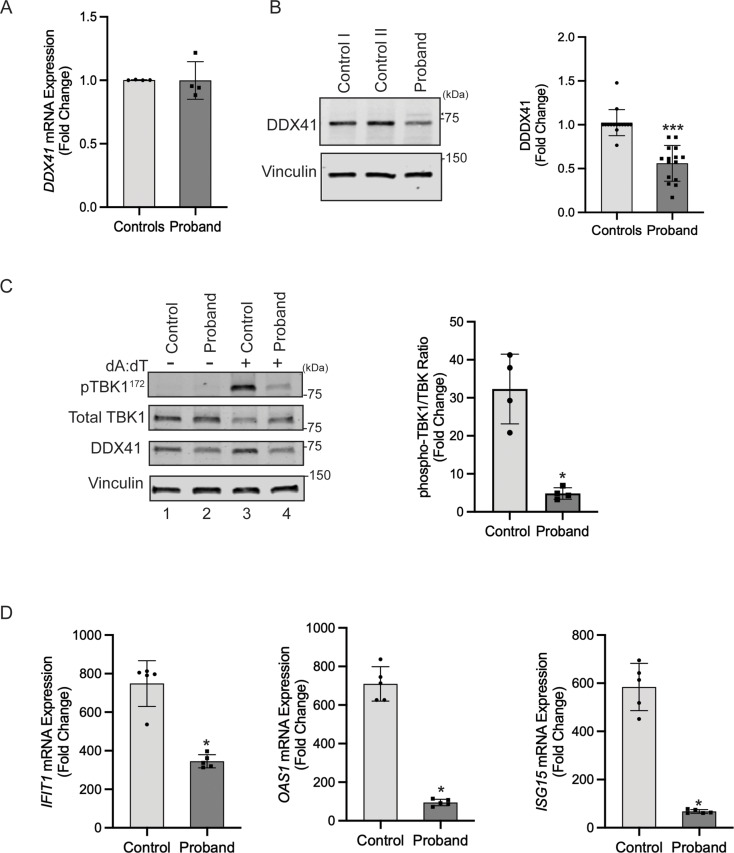
Fig. 2.
Functional analysis of DDX41 in the proband fibroblasts. (A) Quantitative real-time PCR analysis showed no significant difference in mRNA expression between the between the proband and control fibroblasts (error bars indicate ± SD, n = 4). (B) Reduced abundance of DDX41 protein in the proband. (Left) Fibroblasts from controls and the proband were lysed in RIPA buffer. Levels of DDX41 were analyzed through immunoblotting of fibroblast lysates using an anti-DDX41 antibody. Immunoblotting of lysates with anti-vinculin confirmed equal loading of the samples. The positions of two molecular weight markers in kilodaltons are shown. (Right) Quantification shows fold change in protein abundance. The control value represents the mean of data from two controls (error bars indicate ± SD, n = 15 independent experiments, ***= P < 0.0001). (C) Reduced STING signaling in the proband. Control and the proband fibroblasts were stimulated with double-stranded DNA complex (Poly (dA: dT)/LyoVec) for 24 h and processed for protein and RNA extraction. (Left) Immunoblots of lysates with anti-phospho-TBK1, Total-TBK1, and anti-DDX41 are shown. (Right) quantitative analysis shows a significantly reduced phospho-TBK1/Total-TBK1 ratio in the proband’s fibroblasts compared to the control (error bars indicate ± SD, n = 4 independent experiments, *= P < 0.05). (D) Quantitative PCR analysis of cDNA shows significant downregulation of IFN response genes IFIT1, OAS1, and ISG15 in the proband fibroblasts. Error bars indicate ± SD, n = 5, *= P < 0.05)

