Fig. 3.
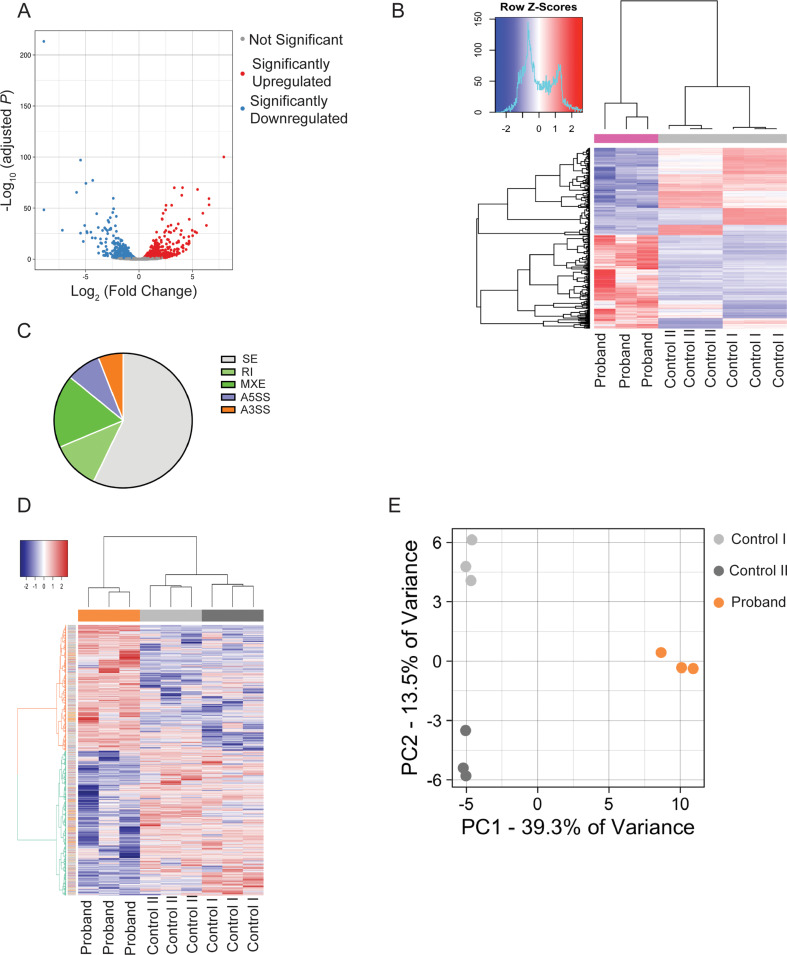
Transcriptome analysis. Analysis of paired-end RNAseq data obtained from 3 technical replicates of two controls (control I and control II) and the proband fibroblasts. In total, 65.4, 63.2, and 63.4 million aligned reads from RNA-Seq libraries made from control I, control II, and proband were obtained. The average base quality score per read (average Phred quality score) was 36.2, the average read length was 150 bp, and 100% of reads could be mapped to the human reference genome. (A) Volcano plot showing differentially expressed genes (DEGs) in the proband fibroblasts compared to controls. Red dots represent significantly up-regulated genes, and blue dots represent significantly down-regulated genes. (B) Hierarchical clustered heatmap showing the expression patterns of DEGs. Analysis of significant alternative splicing (differentially spliced) events in the proband compared to control fibroblasts using rMATs. (C) Distribution of 7349 RNA splicing events with significantly different frequencies between the proband and control cells: 4194 skipped exon (SE), 843 retained intron (RI), 1289 mutually exclusive exons (MXE), 590 alternative 5′ splice site (A5SS), and 433 alternative 3′ splice site (A3SS). (D) Hierarchical clustered heatmap showing all differentially spliced events in each sample. (E) Principal-component analysis (PCA) of differentially spliced event frequencies showed replicates of each sample that clustered

