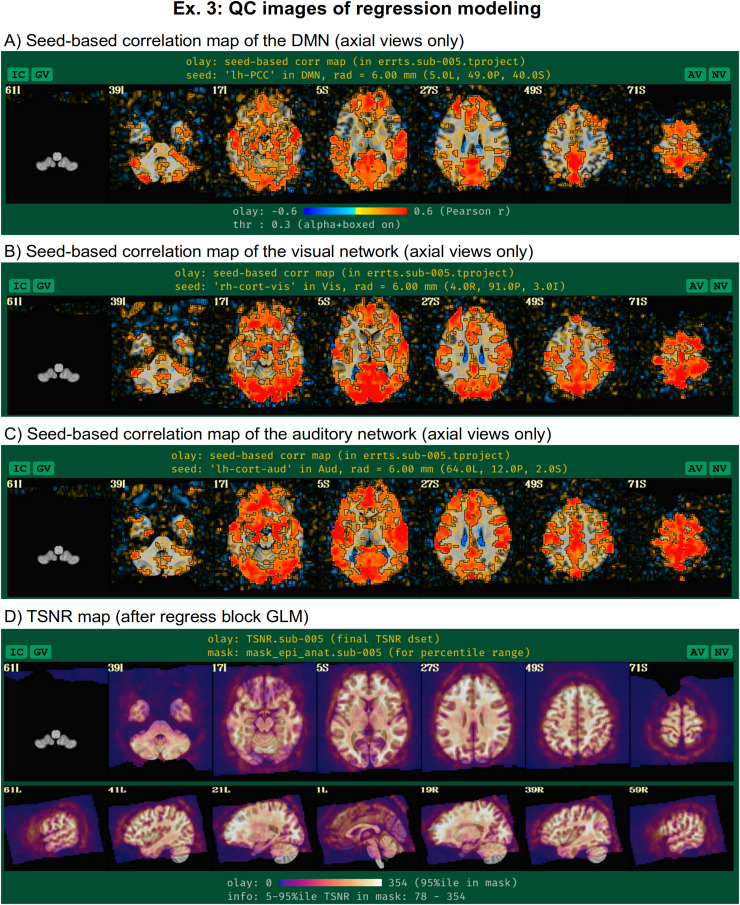
Fig. 15.
QC images of statistical output for resting-state time series, for which the residuals are the time series of interest (Ex. 3). Panels A–C show axial maps the three seed-based correlation maps shown in the APQC HTML when the final space is a known template: for the default mode network (DMN), the visual network, and the auditory network. These allow for checks for artifacts and other potential problems from processing. Panel D displays the TSNR for these data, which can help distinguish regions of strong signal coverage from those with dropout or artifact.

