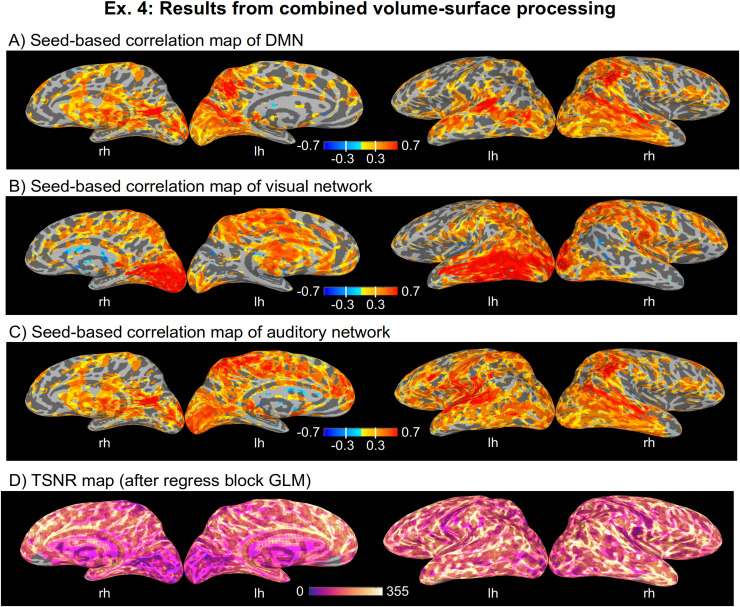
Fig. 18.
Some results generated by afni_proc.py for Ex. 4, which uses surface-based processing for resting-state ME-FMRI data. Images are displayed using SUMA (Saad et al., 2004). Panels A–C show seed-based correlation maps for the same seed locations used in the standard APQC HTML reports when purely volumetric processing is used (cf. Fig. 15A–C, showing QC images for Ex. 3). Panel D shows the TSNR across the cortical surface, for ME-FMRI data which have been processed using MEICA-estimated regressors. Some empty patches in the TSNR maps reflect the fact that the utilized MEICA requires brainmasking and occurs before surface projection.

