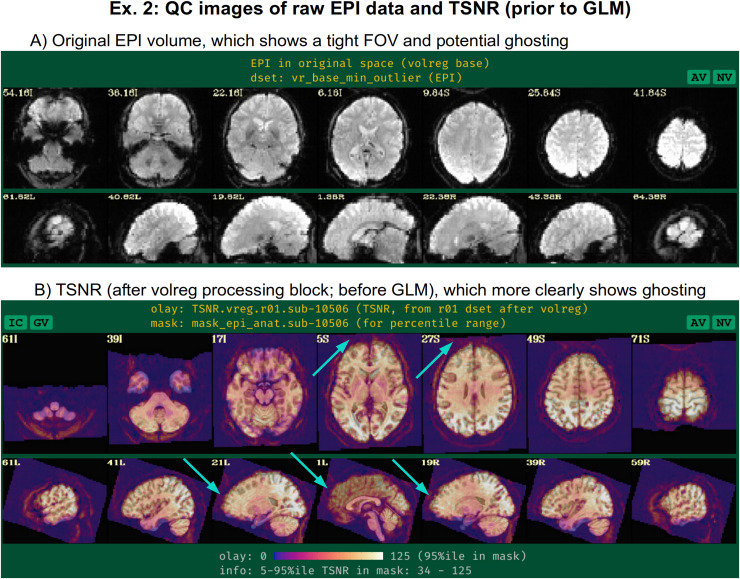
Fig. 9.
QC images generated by afni_proc.py for Ex. 2, showing: (A) the raw EPI volume in native space; and (B) the unmasked TSNR after the volreg processing block, prior to regression modeling. The unmasked TSNR image shows evidence for ghosting artifact overlapping into the brain (cyan arrows); as described in Figure 2, this shows the benefits of not masking data during processing to understand it better and more reliably evaluate it. The fact that the EPI has been acquired with such a tight FOV (see panel A) likely contributes to the presence of ghosting. The TSNR map also shows the presence of EPI distortion (the anterior TSNR pattern extends beyond the anatomical boundaries, even though structural alignment is good).

