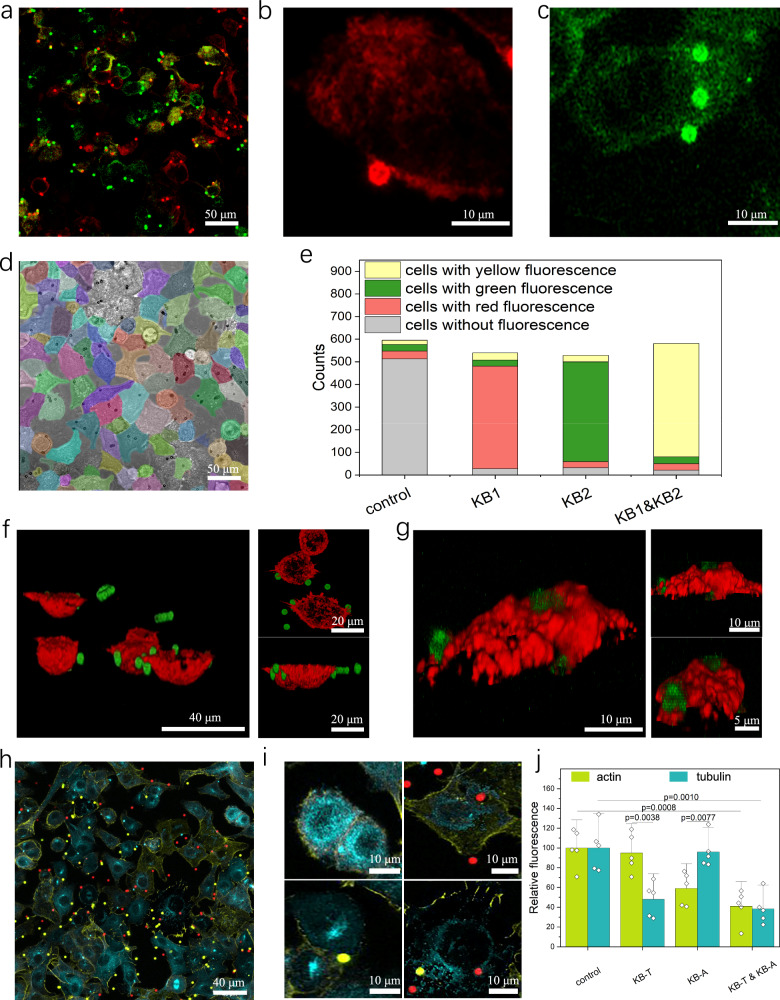
Fig. 4. Single-cell encoded siRNA delivery and gene silencing.
a–c Intracellular delivery with a magnetic field, where RNAs are labeled using cy5 (red) and Fam (green). Red beads are loaded with RNA-cy5, and green beads are loaded with RNA-Fam. d Cell segmentation visualized by a customize algorithm. The cell outline was visualized in different colors to help cell segmentation. e Number of cells categorized differently in (d): control refers cells without Knock-beads, KB1 refers cells with KB1 Knock-beads, KB2 refers cells with KB2 cells. f 3D images of Knock-beads(green) and diffused siRNA(red) and the front and top view. g 3D images of Knock-beads(green) and cell actin(red) and the front and top view. h Cells treated with two types of Knock-beads: anti-actin (KB-A, red) and anti-tubulin (KB-T, yellow). Actin is labeled in yellow, and tubulin is labeled in blue. i Magnified view of (h) cells that contacts with different Knock-beads: top-left is control, top-right contacts with KB-A, bottom-left contacts with KB-T, bottom-right contacts both KB-T and KB-A. j Quantification of fluorescence intensity for actin and tubulin: control refers cells without Knock-beads, KB-T refers cells with KB-T Knock-beads, KB-A refers cells with KB-A Knock-beads. Data are presented as the mean ± SD, n = 5, analyzed using two-tailed unpaired t test. For panel (a–c, f–h), three independent experiments were conducted. Source data are provided as a Source Data file.

