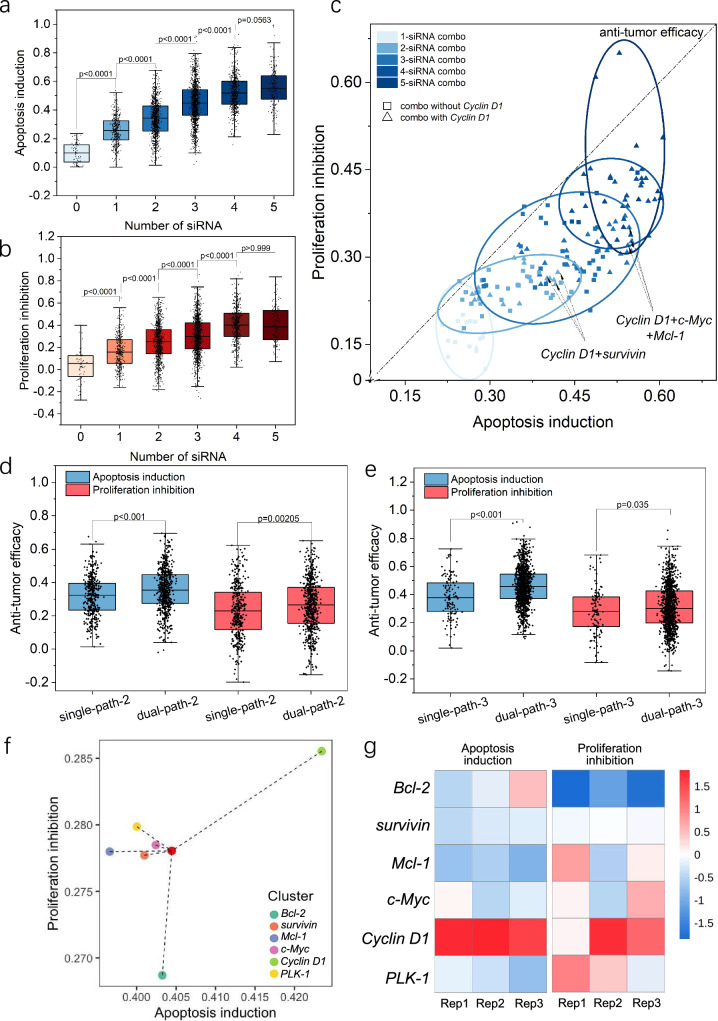
Fig. 6. Analysis of Knock-combo screening results to optimal siRNA cocktails.
a Effect of siRNA number on the induction of cellular apoptosis. b Effect of siRNA numbers on the inhibition of cellular proliferation. c Scattered plot showing the distribution of the knock-combo efficacy classified by the number of siRNAs. The dotted line (f(x) = x) refers to the total anti-tumor efficacy with equal weight of cellular apoptosis and proliferation in determining the final efficacy. Comparison between single or dual pathway gene silencing by different Knock-combos composed of 3 (d) or 2 (e) siRNAs. The black dots indicate the measurements from individual cells. f Centroid distribution illustrating the apoptosis induction and proliferation inhibition efficacy of Knock-combos containing specific siRNA. g Heatmap showing the apoptosis induction and proliferation inhibition efficacy for Knock-combos containing specific siRNA. The color index indicates the Z-score normalized phenotype quantification. Three rounds of screening were performed. For each knock combo, n > 20 per round. For panel (a, b), the data was analyzed using unpaired one-way ANOVA; for panel (d, e), the data was analyzed using non-parametric Mann–Whitney test. For the boxplots (a, b, d, e), the black dots indicate an overlay of individual data points, each box indicates the first quartile, median, third quartile of the data, the whisker limit is 1.5 times the interquartile range. Source data are provided as a Source Data file.

