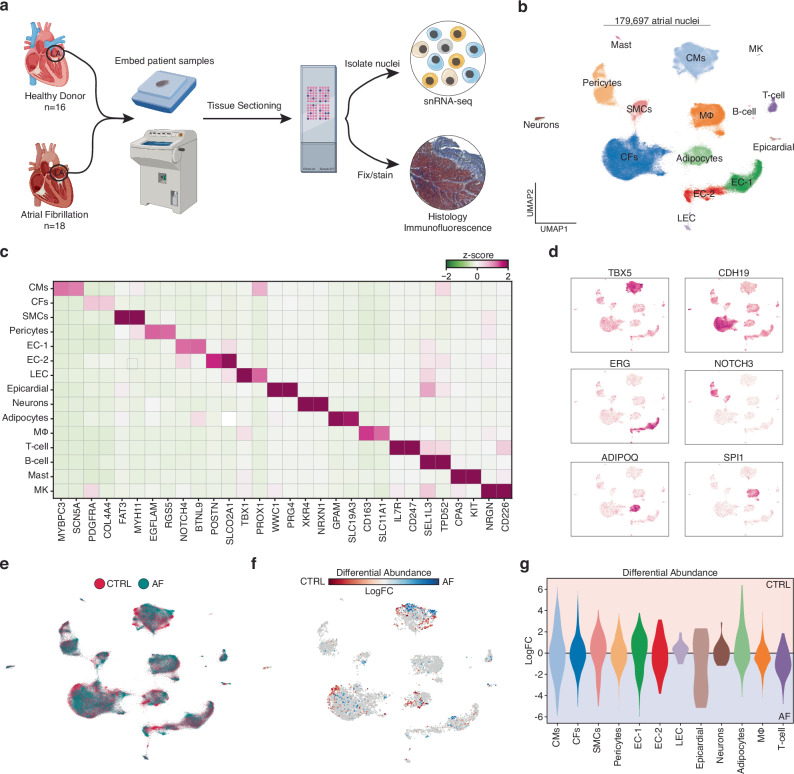
Fig. 1. Cellular Composition in the LA from patients with and without atrial fibrillation.
a Schematic of experimental setup and tissue processing pipeline. Created partly in BioRender. Hill, M. (2021) BioRender.com/e34r263. b Uniform manifold approximation and projection (UMAP) representation of 179,697 left atrial cardiac nuclei isolated from a total of 30 donors. c Heatmap displaying the expression of marker genes for each cluster (cell type). Low median z-score of normalized expression highlighted in green. High expression showed in purple. d Feature plots of gene expression. High expression shown in purple. e UMAP displaying the clinical designation of each transcriptome. Healthy controls denoted by red, and AF patients are highlighted in blue. f Embedding of the Milo k-nearest neighbor differential abundance testing results for all cell types. Neighborhoods colored by log fold changes for Control (CTRL) versus AF. A negative (blue) log fold change indicates enrichment in AF, and a positive (red) log fold change represents an enrichment in CTRL. Nonsignificant neighborhoods (false discovery rate (FDR) > 5%) are shown in white. g Milo k-nearest neighbor differential abundance testing results scored by individual cell type. Cell types colored as in Fig. 1b.

