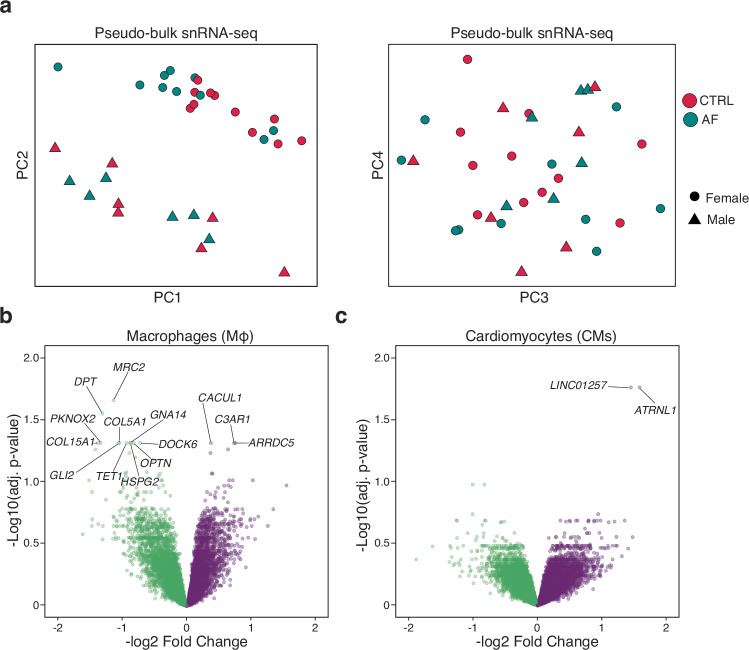
Fig. 2. Differentially expressed genes in atrial fibrillation.
a PCA plots for pseudobulk RNA-seq analysis of samples by diagnosis. Red is control (CTRL) and blue is AF cases. Female samples are shaped as circular and male samples by triangles. b Volcano plot displaying the differentially expressed genes in macrophages between controls and AF cases. c Volcano plot displaying the differentially expressed genes in CMs between controls and AF cases. Volcano plots show log fold change and two-sided P-value expression changes between AF and CTRL for each gene tested using limma–voom differential expression analysis (“Methods”).

