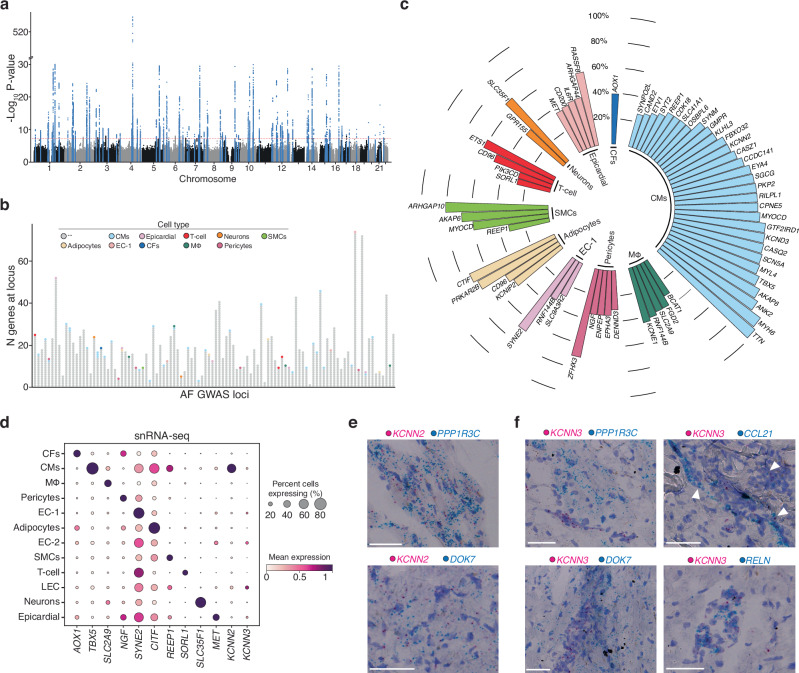
Fig. 6. Integration of AF snRNA-seq data with a multi-ancestry genome-wide association study for AF.
a Manhattan plot for Roselli et al. AF GWAS main results17. The dotted line marks the cutoff for genome-wide significance (P-value < 5 × 10⁻⁸, that accounts for multiple testing across the genome). Highlighted in blue are the genetic loci that reached genome-wide significance, which were used to select the region (1 mega base (MB) around sentinel variants) and identify overlapping genes for the integration with snRNA-seq data. The y-axis of the plot has a break between -log10(P-value) of 30 and 510 to for visibility. The significance level accounts for multiple testing of independent variants with using a Bonferroni correction. P values (two-sided) were derived from a meta-analysis using a fixed-effects model with an inverse-variance weighted approach. b Stacked dotplot with one column for each genetic locus examined. Each dot represents a gene at the genetic locus, showing the range of number of genes within 1 MB of sentinel variants. Some loci including more than 60 genes close to the sentinel variant. Genes that overlap with the marker genes for the snRNA-seq cell types are labeled in cell-type specific colors as in Fig. 1b. Gray dots indicate genes that did not overlap. The cell-types color scheme is shown in the legend. c Circular plot of all marker genes that intersected with the AF GWAS loci, sorted by percent of cells expressing the gene and cell-type. Cell types are labeled in cell-type specific colors as in Fig. 1b. d Dot plot displaying expression for each indicated cell population. Size represents the percent of cells expressing each marker. e RNA-ISH images of LA tissue displaying expression of KCNN2 (shown in pink) and the CM markers PPP1R3C (top, shown in blue) and DOK7 (bottom, shown in blue). Scale bars = 50 μm. f RNA-ISH images of LA tissue displaying expression of KCNN3 (shown in pink) and the CM markers PPP1R3C (top left, shown in blue) and DOK7 (bottom left, shown in blue). Expression of KCNN3 (shown in pink) and the LEC markers CCL21 (top right, shown in blue) and RELN (bottom right, shown in blue). Scale bars = 50 μm.

