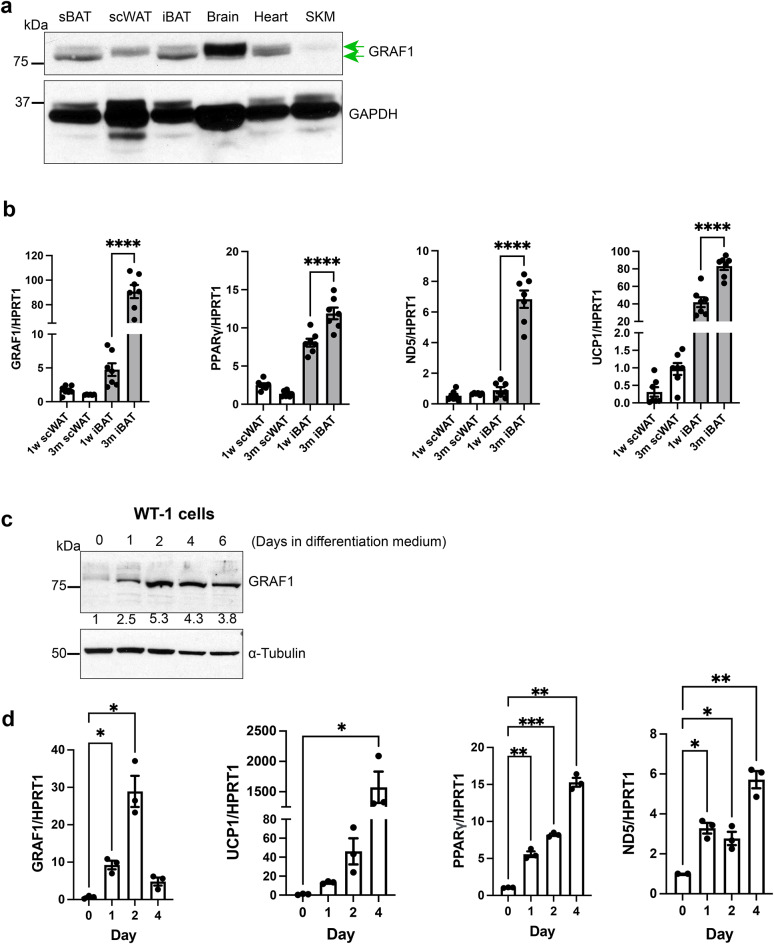
Fig. 1.
GRAF1 expression closely correlates with BAT maturation. (a) GRAF1 protein levels in 3-week postnatal male mouse tissue detected by Western blotting. scWAT, sub-cutaneous white adipose tissue; iBAT and sBAT, inter- and sub-scapular brown adipose tissue, SKM, skeletal muscle. Two green arrows denote the presence of two GRAF1 bands observed in the blot. (b) qRT-PCR of GRAF1 and adipocyte marker genes in indicated adipose depot isolated from 1 week old and 3-month-old male and female mice, n=6-7. (c,d) WT-1 pre-brown adipocytes were exposed to brown fat-inducing insulin differentiation medium for the indicated times, subsequent Western blotting analysis of GRAF1 level ((c) densitometric values of GRAF1 were measured and presented below each corresponding GRAF1 band, blot is representative of n=3 independent experiments) or qRT-PCR analysis of indicated adipocyte markers ((d) n=3 biological replicates). Data are represented as mean ± SEM, *P < 0.05; **P < 0.01; ***<0.001;****P < 0.0001 by two-tailed student’s t-test (b) or mixed effect analysis with post-hoc Fisher’s LSD test (d).

