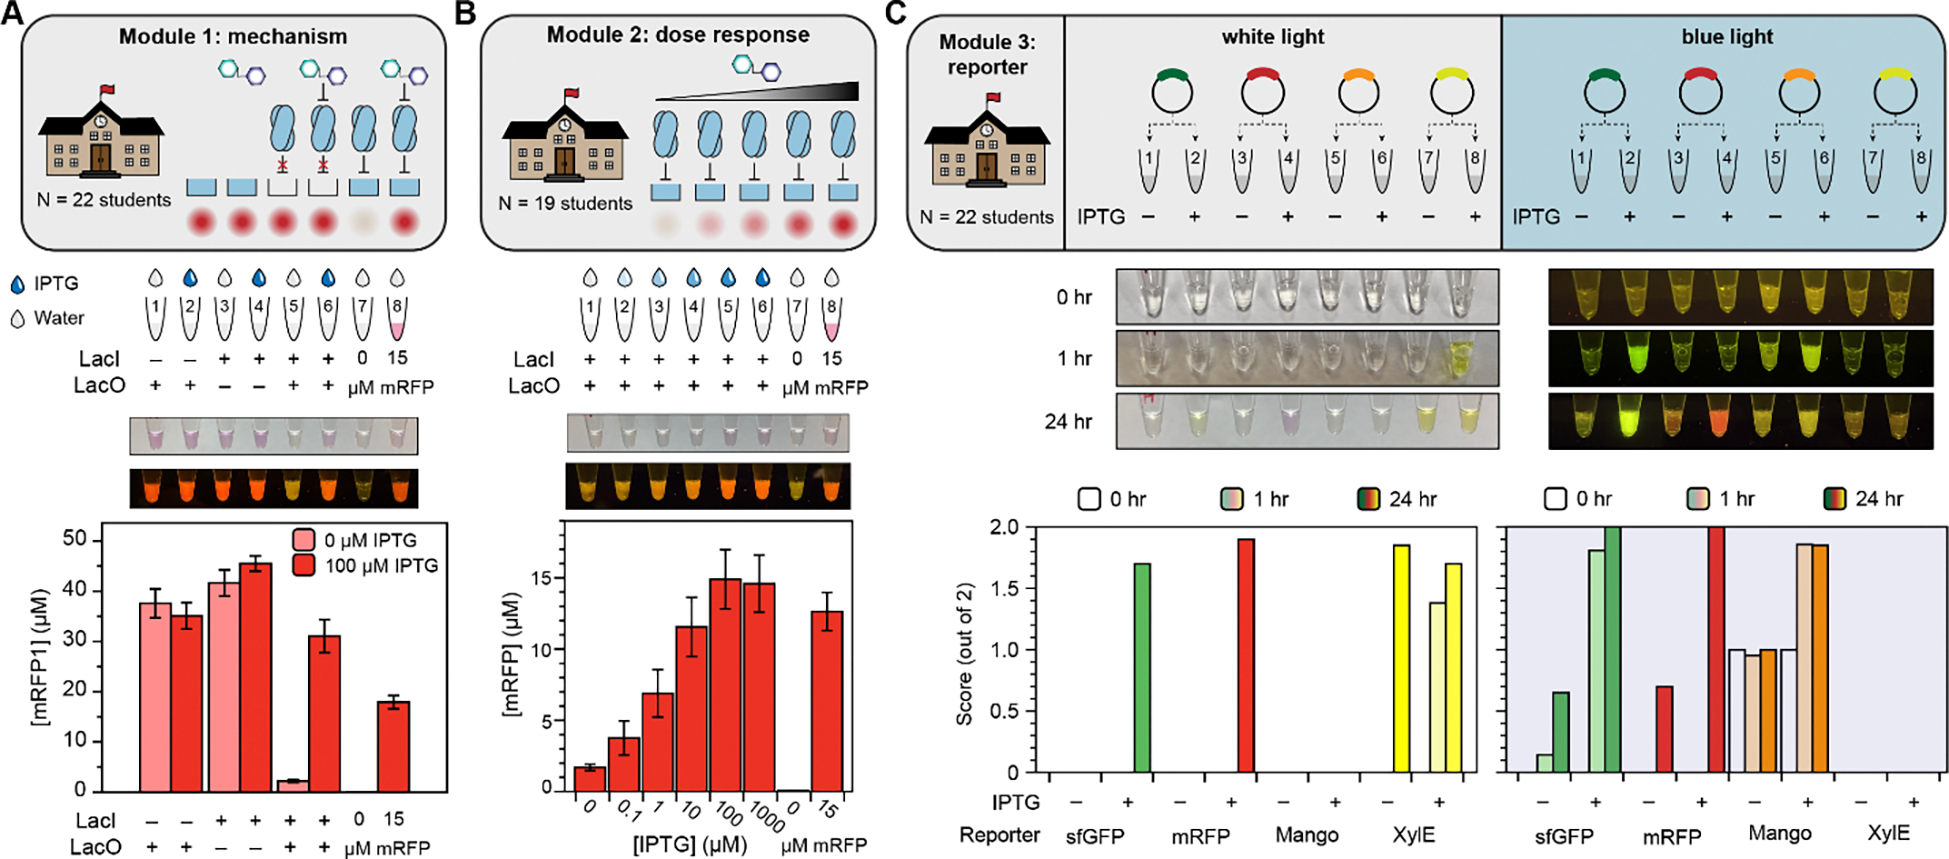
Figure 2. Results of small-scale deployment of biosensing educational kit in advanced high school classroom.

(A) Implementation of Module 1 (mechanism) experiment in high school classroom. Students added either water or 100 μM IPTG to the indicated tubes using a micropipette, and the reactions were incubated for 48 hours at room temperature. Then, the reactions were collected, and yields were quantified by plate reader. Bars represent the average, and error bars represent the standard error of the mean, from 22 replicates. Inset photos represent white and blue light photos (in P1 imager) of a sample replicate. (Full student data for all modules are available in the Supplemental Files 2–4) (B) Implementation of Module 2 (dose response) experiment in high school classroom. Reactions were incubated for 48 hours at room temperature and quantified by plate reader. Data represent the average and standard error of the mean from 19 student replicates, with one representative sample photo taken at endpoint in white and blue light. (C) Implementation of Module 3 (reporters) experiment in high school classroom. Students added reporter plasmids as indicated; then, reactions were incubated at 30 °C and photographs were taken in white and blue light at t = 0 hours, 1 hour, and 24 hours for each reaction set. Researchers then qualitatively assigned to each photograph values 0, 1, or 2 to represent “OFF”, “FAINT”, or “ON”, respectively. The indicated bars represent the average score from 21 student replicates of the reporter activity at each time point (indicated by bar shading), for each reporter (indicated by bar color), and in white and blue light (left and right plots, respectively). One sample time-course with paired photos is shown.
