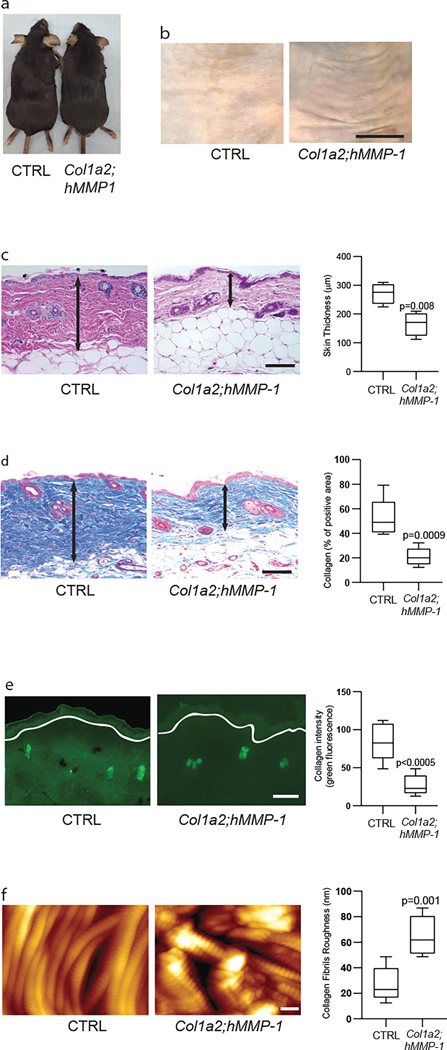
Figure 2. Fibroblast-selective expression of human MMP1 in mouse skin causes age-related dermal collagen alterations.
(a) Representative gross appearance of control (left) and Col1a2;hMMP1 mice (right). (b) Representative images of skin wrinkles in control (left) and Col1a2;hMMP1 mice (right). N=5 per group. Bar=5mm. (c) Representative H&E staining of back skin from control (left panel) and Col1a2;hMMP1 (right panel) mice. The dermal thickness was quantified by Image J software (NIH, Bethesda, MD). Note thinness of dermis in Col1a2;hMMP1 mouse. N=5 per group. Bar=100 μm. (d) Representative Mason’s Trichrome staining of 6 months old control (left panel) and Col1a2;hMMP1 (right panel) mice. Cells stain red and collagen fibrils stain blue. The dermal collagen density (blue) was quantified by Image J software (NIH, Bethesda, MD). Note fewer collagen fibril bundles in Col1a2;hMMP1 mice. N=5 per group. Bar=100 μm. (e) Representative images of in situ zymography, which assesses collagenase activity, in control (left panel) and Col1a2;hMMP1 (right panel) mice. Loss of green fluorescence in Col1a2;hMMP1 mice indicates degradation of fluorescein-labeled collagen substrate. The fluorescein collagen signals were quantified by Image J software (NIH, Bethesda, MD). White lines indicate the boundary between the epidermis and dermis. N=5 per group. Bar=100 μm. (f) Representative nanoscale atomic force microscopy images of collagen fibrils from control (left panel) and Col1a2;hMMP1 (right panel) mice. Note intact densely-packed collagen fibrils in control, compared to fragmented, disorganized collagen fibrils in Col1a2;hMMP1 mice. Dermal collagen fibril organization, measured as collagen fibril average roughness (Ra, nm), was quantified using Nanoscope Analysis software (Nanoscope_Analysis_v120R1sr3, Bruker-AXS, Santa Barbara, CA). N=5 per group. Bar=100 μm.

