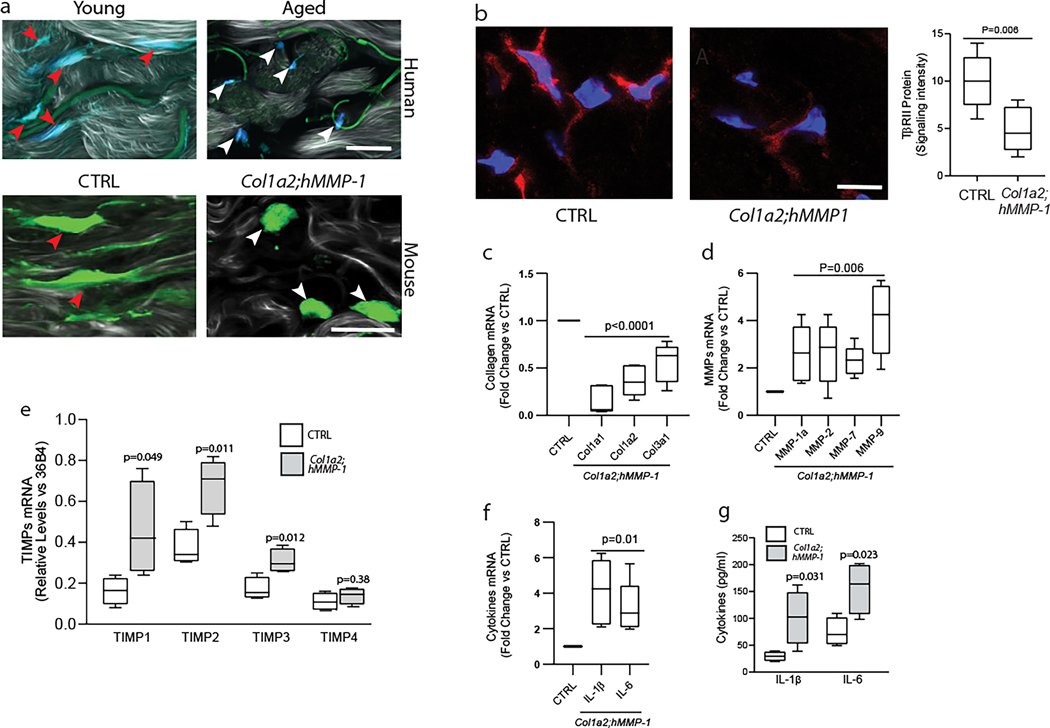
Figure 3. Fibroblast-selective expression of human MMP1 in mouse skin causes age-related deleterious alterations of the dermal microenvironment.
(a) Upper panels: representative images of human skin dermal fibroblasts in young (26 years, left panel) and aged (78 years, right panel) human skin. Dermal fibroblasts were identified by immunostaining with collagen chaperone heat shock protein 47 (blue). Green signals indicate elastin autofluorescence. Lower panels: representative images of mouse skin dermal fibroblasts in control (lower left panel) and Col1a2;hMMP1 mice (lower right panel). Dermal cells in frozen skin sections were stained with HCS CellMask™ Deep Red Stain (green). SHG imaging of collagen fibrils is shown in shades of gray. Note stretched fibroblasts (red arrowheads) in young human skin and control mice versus contracted fibroblasts (white arrowheads) in aged human skin and Col1a2;hMMP1 mice. Images were obtained by multiphoton laser scanning fluorescence microscopy. N=6 for each group. Bars=25μm. (b) Reduced TβRII protein in the dermis of Col1a2;hMMP1 mice. TβRII protein was identified by immunofluorescence staining (red), and nuclei were stained with DAPI (blue). The fluorescence signals were quantified by Image J software (NIH, Bethesda, MD). Representative images are shown, N=5 for each group. (c) Reduced expression of major collagens (Col1a1, Col1a2, and Col1a3), (d) Increased expression of multiple collagen-degrading MMPs; (e) Increased expression of TIMPs, and (f, g) Increased expression of inflammaging-related cytokines (IL-1β, and IL-6) in the skin of Col1a2;hMMP1 mice. mRNA levels were determined by RT-PCR (normalized to 36B4, housekeeping gene internal control). N=5 for each group. Mouse skin homogenates were used for the ELISA (IL-1β, and IL-6) analysis. N=4 for each group. Statistical analyses (t-tests) were performed to evaluate the significance between the two groups. All P-values are considered significant when <0.05.

