. 2024 Oct 21. Online ahead of print. doi: 10.1039/d4sc05206d

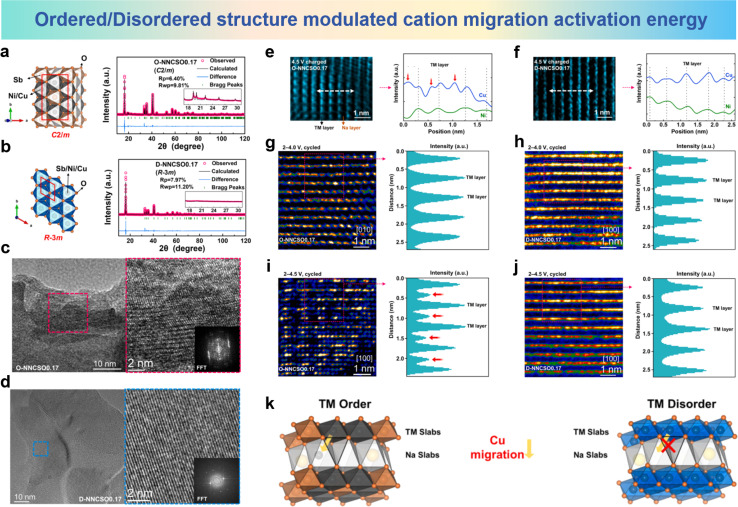
Fig. 20. Crystal structure of honeycomb-ordered (left) and XRD Rietveld refinement patterns (right) for (a) O-NNCSO0.17 and (b) D-NNCSO0.17. HRTEM images and FFT patterns of (c) O-NNCSO0.17 and (d) D-NNCSO0.17 after 50 cycles between 2.0 and 4.5 V. HAADF-STEM images and corresponding STEM-EDS line profiles of Cu and Ni elements along the white arrow of (e) O-NNCSO0.17 and (f) D-NNCSO0.17 viewed along the [100] direction. HRTEM images along the [100]/[010] direction (left) and corresponding intensity-profiles (right) of (g) O-NNCSO0.17 and (h) D-NNCSO0.17 after 50 cycles between 2.0 and 4.0 V. HRTEM images along the [100] direction (left) and corresponding intensity-profiles (right) of (i) O-NNCSO0.17 and (j) D-NNCSO0.17 after 50 cycles between 2.0 and 4.5 V. (k) Schematic diagrams of crystal structures of TM ordered compounds and disordered compounds. (a)–(k) are reprinted with permission from ref. 193. Copyright 2024 Elsevier.

Fig. 20