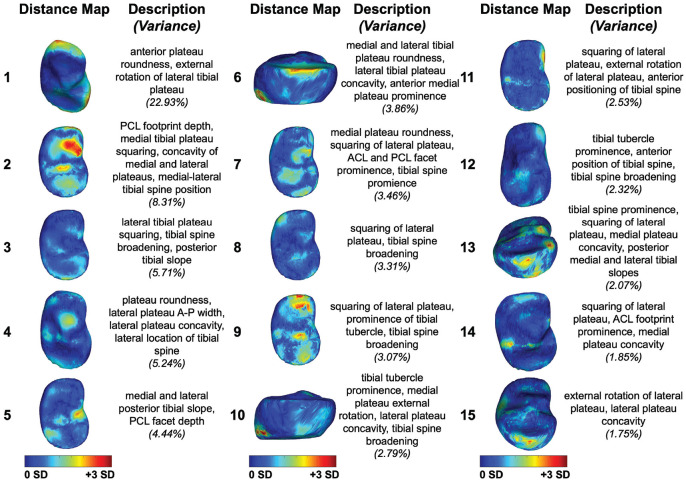
Figure 4.
The first 15 principal component analysis (PCA) modes of the proximal tibia accounted for 73.60% of the PCA-normalized accumulated total variance. Each mode is represented by the spatial distribution of the vertex displacements equal to mean ± 3 SD, each oriented to illustrate the prominent features captured by the respective mode. Descriptions denote key shape features described by each mode. Variances represent the variance accounted for by each distinct mode. ACL, anterior cruciate ligament; A-P, anterior-to-posterior; PCL, posterior cruciate ligament.

