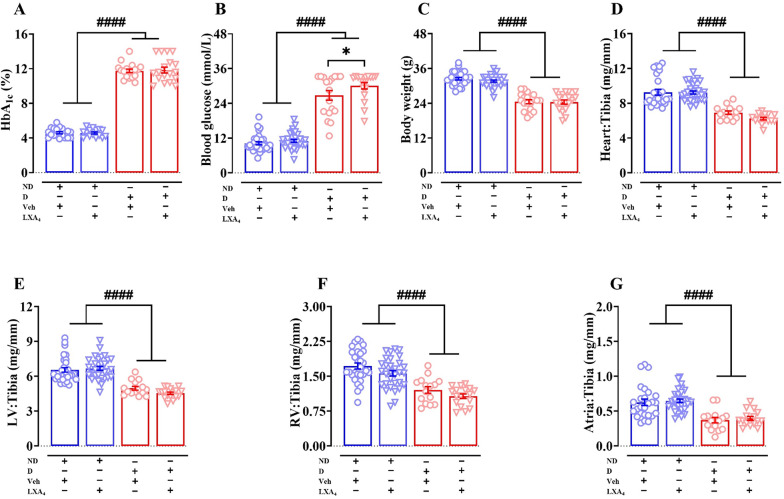
Fig. 1.
Metabolic parameters at study endpoint. A Endpoint HbA1c levels. B Endpoint blood glucose levels. C Endpoint body weight. D–G Cardiac weight relative to tibia length. Data are presented as means ± SEM. Two-way ANOVA followed by Fisher’s LSD post hoc test was used to compare the effects of phenotype and treatment. *p < 0.05, ####p < 0.0001. HbA1c, glycated haemoglobin; LV, left ventricle; RV, right ventricle; ND, non-diabetic; D, diabetic; Veh, vehicle

