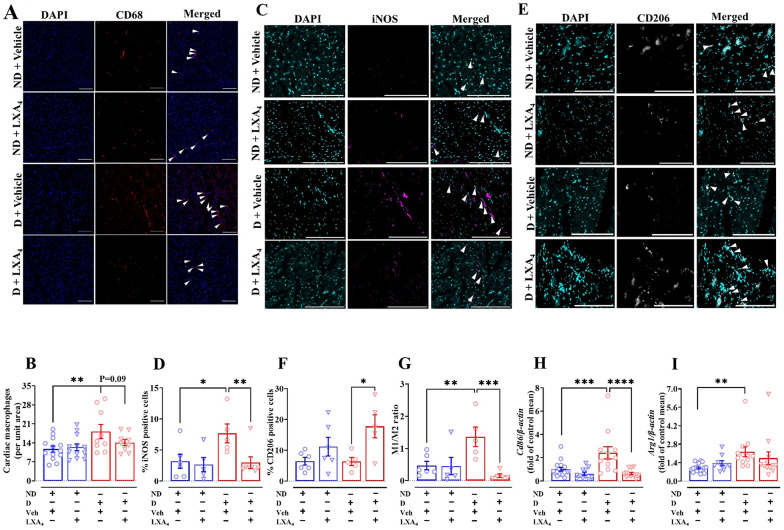
Fig. 2.
Effects of lipoxin A4 on macrophage polarization in LV. A Representative images of macrophages in the left ventricle, co-stained with nuclei (blue, DAPI) and macrophage (red, CD68). Scale bar = 200 μm. B Quantitative data of CD68-positive macrophages. C Representative images of M1-like macrophages in the left ventricle, co-stained with nuclei (cyan, DAPI) and M1-like macrophage (magenta, iNOS). Scale bar = 200 μm. D Quantitative data of iNOS-positive macrophages. E Representative images of M2-like macrophages in the left ventricle, co-stained with nuclei (cyan, DAPI) and M2-like macrophage (grey, CD206). Scale bar = 200 μm. F Quantitative data of CD206-positive macrophages. G M1/M2 macrophage ratio H mRNA expression of mCd86 in mouse left ventricle. I mRNA expression of mArg1 in mouse left ventricle. Data are presented as mean ± SEM, Two-way ANOVA followed by Fisher’s LSD post hoc test was used to compare the effects of phenotype and treatment. *P < 0.05, **P < 0.01, ***P < 0.001 and ****P < 0.0001. Arg1, arginase-1

