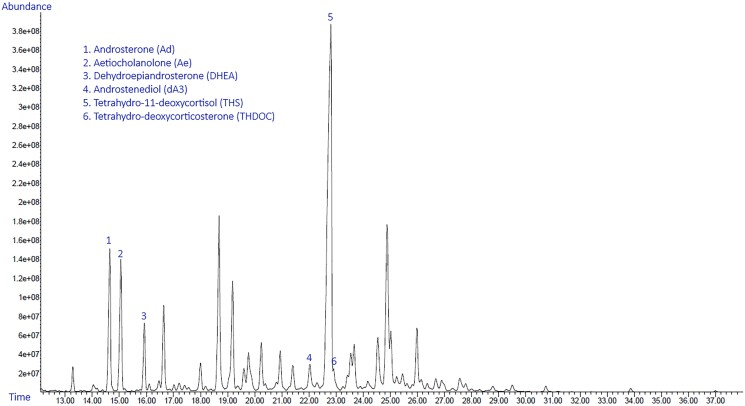
. 2024 Nov 20;2(12):luae207. doi: 10.1210/jcemcr/luae207
© The Author(s) 2024. Published by Oxford University Press on behalf of the Endocrine Society.
This is an Open Access article distributed under the terms of the Creative Commons Attribution-NonCommercial-NoDerivs licence (https://creativecommons.org/licenses/by-nc-nd/4.0/), which permits non-commercial reproduction and distribution of the work, in any medium, provided the original work is not altered or transformed in any way, and that the work is properly cited. For commercial re-use, please contact reprints@oup.com for reprints and translation rights for reprints. All other permissions can be obtained through our RightsLink service via the Permissions link on the article page on our site—for further information please contact journals.permissions@oup.com. See the journal About page for additional terms.

