Figure 3.
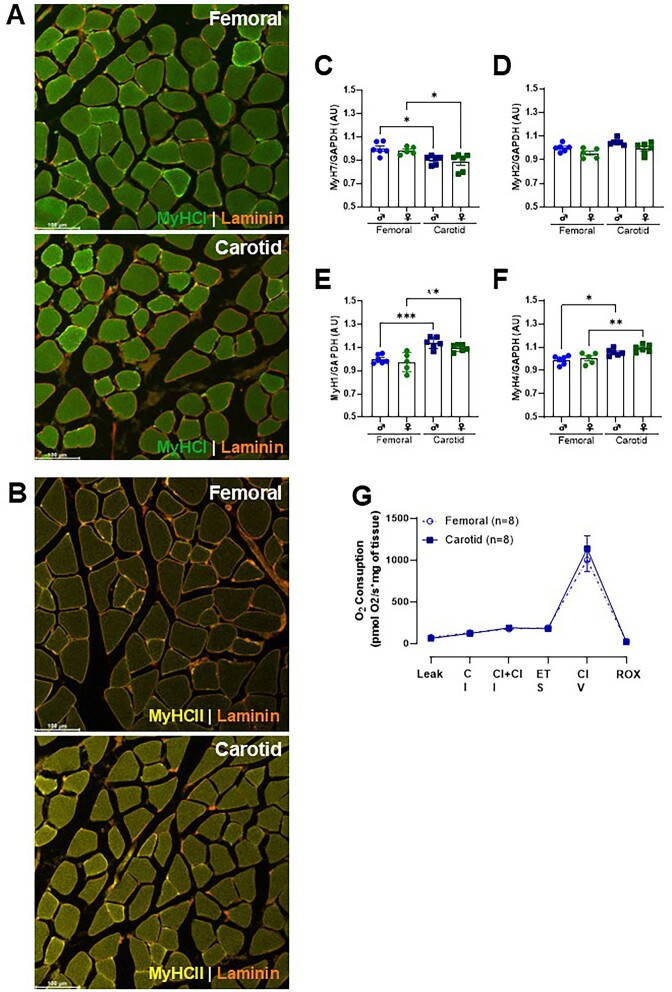
Fiber type-specific distribution of selected markers revealed by immunofluorescence analysis from skeletal muscles surrounding the carotid (sternohyoid) and femoral (adductors). Fiber types are labeled MyHC1 (type 1, green; A), MyHCII (type 2b, yellow; B), and Laminin (red). Gene expression of type I (MyH7; C), type IIa (MyH2; D), type IIx (MyH1; E), and type IIb (MyH4; F) in skeletal muscles surrounding the carotid and femoral arteries. Representative graphs show the oxygen consumption rate measurement upon adding different substrates and inhibitors in skeletal muscles surrounding the carotid and femoral arteries (G). The number of animals used in each experiment (n) is expressed in parentheses or dots. The results are expressed as the mean ± SEM. Statistic: 1-way ANOVA or Student’s t-test as appropriate, *P < 0.05; **P < 0.01; ***P < 0.001.

