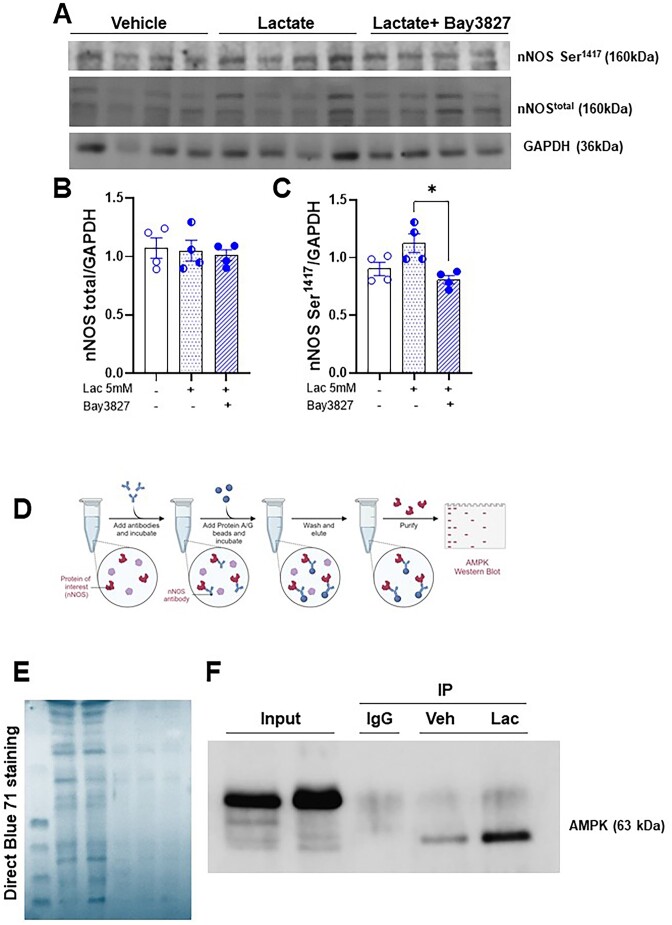
Figure 6.
Representative western blot image of cells from the muscle that surrounds the femoral artery, treated with lactate (5 mm, 1 h) and lactate plus Bay 3827 (specific AMPK inhibitor, 5 μm) and vehicle (A). Bar graphical representation of the expression of total NOS1 (B), NOS1Ser1417(C) and GAPDH as loading control. Illustrative figure of co-immunoprecipitation assays showing interactions of NOS1 with AMPK (D). Coomassie blue staining was used in western blot analysis (E) as a loading control staining method. Representative western bott image for AMPK of NOS1 co-immunoprecipitation in cells treated with lactate (5 mm, 1 h) or vehicle (F). Relative amounts of proteins were shown by densitometry. Each lane was loaded with 50 μg of total protein. The number of animals used in each experiment (n) is expressed in dots. The results are expressed as the mean ± SEM. Statistic: 1-way ANOVA, *P < 0.05. Please note that the original membrane referenced in Figure 6 are in the Suppl. Figures S2-3.

