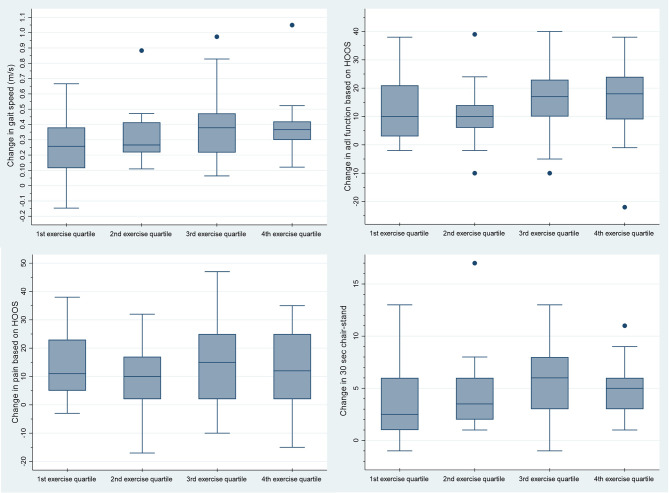
Fig. 2.
Change in four outcomes distributed on quartile groups of exercise dosages. The figure shows box plots of the median change (baseline to follow-up, 3–10 weeks after surgery) in four outcomes distributed on quartile groups of exercise dosages (number of performed repetitions per week). The four outcomes are: change in gait speed (m/s) measured by 40 m fast-paced walk test, change in function measured by Hip disability and Osteoarthritis Outcome Score (HOOS) (subscale adl), change in pain measured by HOOS and change in lower-extremity function measured by 30s-chair-stand. The dots represent outlying results

