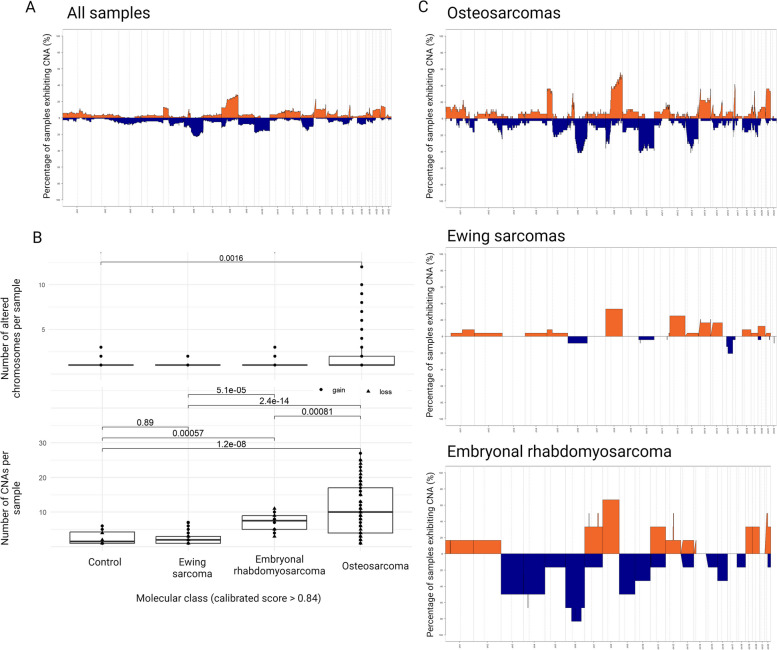
Fig. 3.
Copy number profiles of pediatric sarcomas. A Recurrent copy number alterations (%) in all pediatric sarcomas and among the more common molecular classes. Gray line means a chromosome and dashed gray lines centromeric regions dividing p and q arms. Zero means two copies, above zero gain and below zero loss. B Number of altered chromosomes and number of copy number alterations among the more common molecular classes, including benign samples. C Percentage of copy number alterations among the more common molecular classes. Orange: gain, Blue: loss. Created with BioRender.com (x24n652)

