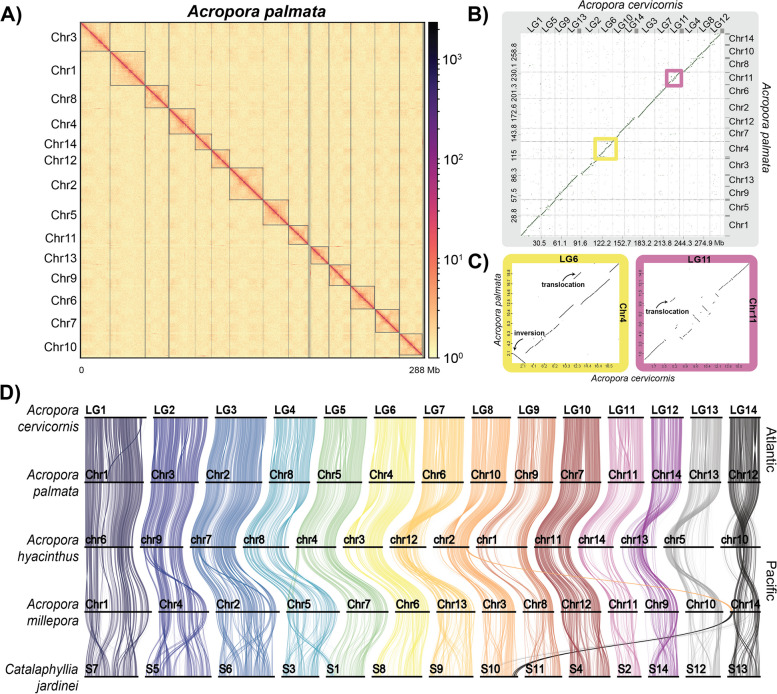
Fig. 2.
Atlantic acroporid genome assemblies. A Hi-C contact map of A. palmata genome resolved into 14 chromosomes using HiCAssembler [87]. B Dot plot visualization of colinear relationships of the 14 chromosomes/linkage groups between the sister species A. palmata (y-axis) and A. cervicornis (x-axis) using the D-genies web server [136]. The scale on each axis is in megabases (Mb). The points along the diagonal represent colinear genomic regions whereas those dots off the diagonal represent rearrangements (insertions, deletions, inversions and translocations). Yellow and purple boxes highlight two chromosomes, A. cervicornis LG6 and LG11, with complex rearrangements. (C, left) Comparison of A. cervicornis LG6 to A. palmata Chr4 reveals a 2.5 Mb inversion and 1.4 Mb translocation. (C, right) Complex rearrangements observed between A. cervicornis LG11 and A. palmata Chr 11, including a 0.765 Mb translocation. D Ribbon plot of syntenic orthologous genes conserved among scleractinians. The colored vertical links connect orthologous genes to the numbered chromosomes of the five species, represented by horizontal bars. Chromosome fusions or fissions are represented by crossing over of the colors that represent each ancestral linkage group. Chromosomal inversions were detected between Atlantic and Pacific acroporids (e.g. A. cervicornis L4, L6, and L12). Chromosomal changes were more numerous between Pacific than Atlantic acroporids. Comparing A. hyacinthus Chr 5, 10, 12 and 13 to all other acroporids indicates paracentric inversions of whole chromosome arms in this species

