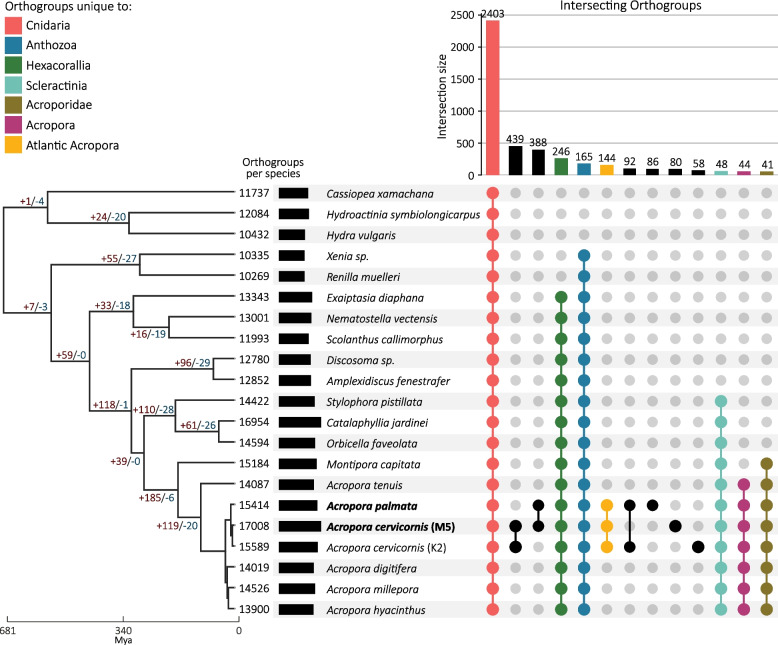
Fig. 3.
Conservation of gene content among cnidarians. UpSet plot displaying the number of shared orthologous groups amongst selected taxonomic groups—Cnidaria (red), Anthozoa (blue), Hexacorallia (green), Scleractinia (teal), Acroporidae (green brown), Acropora (purple) and Atlantic (Caribbean) Acropora (yellow). The colored or black circles below the vertical bar chart indicate those species that belong to each intersection group. On the left, the bar chart represents the total number of orthologous groups identified in each taxon. Taxon labels in bold were assembled in this study. The species tree constructed from a multiple-sequence alignment of 1,011 single-copy orthogroups (348,712 amino acid positions) was inferred by STAG and rooted by STRIDE in OrthoFinder v2.5.2 [144]. The species tree was time-calibrated using r8s [147] with priors for Acropora (101 million years, [148]), Acroporidae (168 million years, [149]), Scleractinia (268 million years, [150]), and Anthozoa (541 million years, [151]) accessed via the Paleobiology Database [152]. Node values depict the number of significant (p < 0.05) gene family expansions ( +) and contractions (-) identified by CAFE 5 [153]. Node values are not depicted for nodes internal to Acropora

