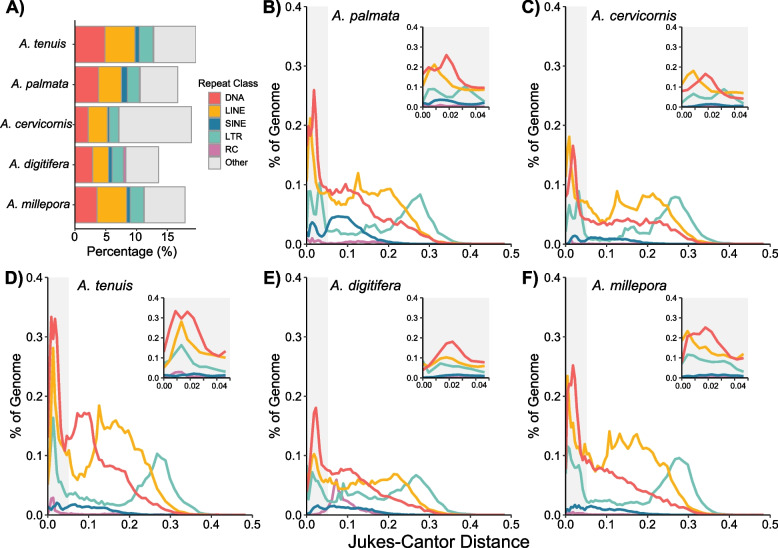
Fig. 4.
Comparison of repetitive DNA among acroporid taxa. (A) Percentage of the genome attributed to the main transposable element classes [DNA transposons, long interspersed nuclear element (LINE), short interspersed nuclear element (SINE), long terminal repeat (LTR), rolling circle (RC) and other (satellites, simple repeats, and unclassified)] for each acroporid taxon. (B-F) Repeat landscapes of all transposable element classes except “other” for A. palmata (B), A. cervicornis (C), A. tenuis (D), A. digitifera (E) and A. millepora (F). The percentage of genome coverage (y-axis) of each repeat is shown relative to the Jukes-Cantor genetic distance observed between a given repetitive element and its respective consensus sequence. Individual repetitive elements were then summarized by their repeat class. The more recent repetitive element copies have lower Jukes-Cantor distance on the left side of the x-axis. The inset plot in each panel focuses on recent repeat insertions at a Jukes-Cantor distance below 0.05 (gray shaded region in full plot)

