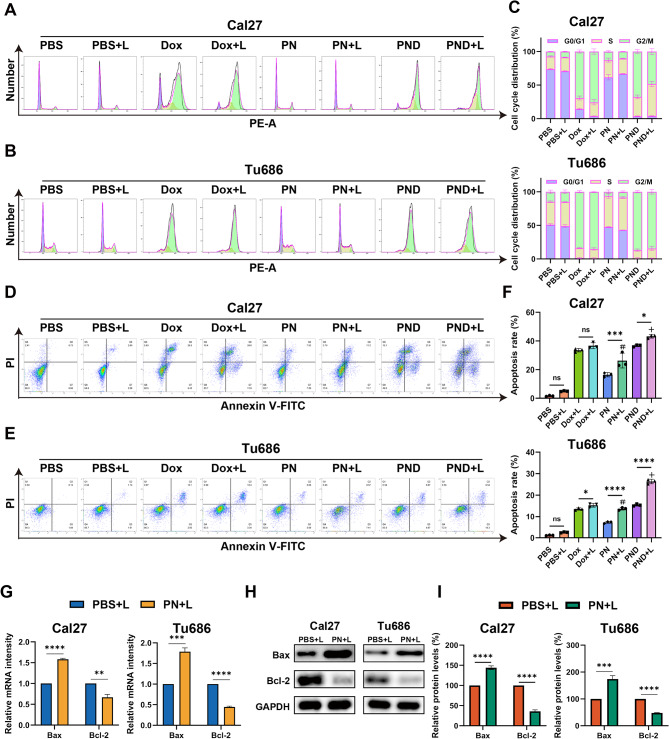
Fig. 2.
PN and PND induced cell apoptosis of HNSCC cells. A-C Cal27 and Tu686 cells were treated with different interventions, and the cell cycle was assessed by flow cytometry. D-F Cal27 and Tu686 cells were treated with different interventions, and the apoptosis rate was assessed by flow cytometry. G Cal27 and Tu686 cells were treated with PBS + L or PN + L for 48 h. The mRNA levels of Bax, Bcl-2 were assessed using qRT-PCR. H-I Cal27 and Tu686 cells were treated with PBS + L or PN + L. The protein levels of Bax, Bcl-2 were assessed using Western blotting. *p < 0.05, **p < 0.01, ***p < 0.001, ****p < 0.0001. Compared to PBS + L group: #p < 0.001. Compared to PN + L group: +p < 0.001, ¯p > 0.05. All data are shown as the mean ± SD from three independent experiments

