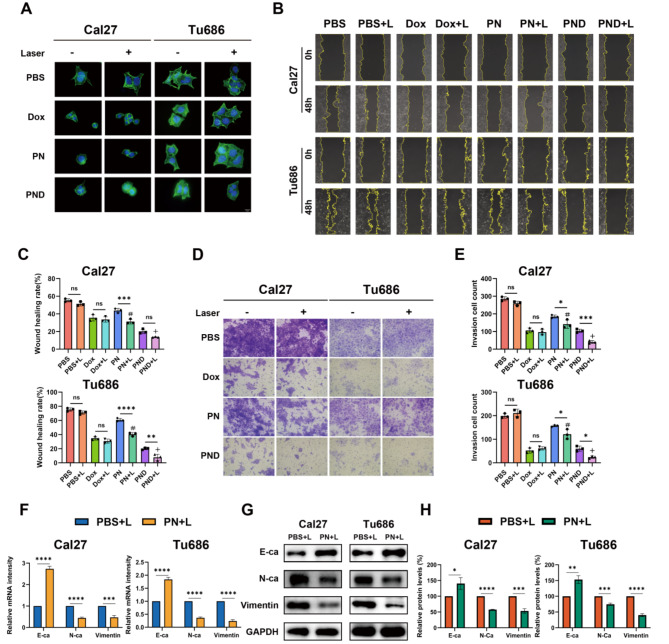
Fig. 3.
PN and PND inhibited cell migration, invasion and EMT ability of HNSCC cells. A Cal27 and Tu686 cells were treated with different interventions, and the Phalloidin staining was observed by microscope. Scale bar: 10 μm. B-C Wound healing assay assessed the migration ability of Cal27 and Tu686 cells treated with different interventions. Statistical results of wound closure were presented. Scale bar: 50 μm. D-E Transwell invasion assay determined the number of HNSCC cells penetrating the lower chamber and captured images using microscopy. Statistical results were presented. Scale bar: 50 μm. F Cal27 and Tu686 cells were treated with PBS + L or PN + L for 48 h. The mRNA levels of E-cadherin, N-cadherin and Vimentin were assessed using qRT-PCR. G-H Cal27 and Tu686 cells were treated with PBS + L or PN + L. Protein levels of E-cadherin, N-cadherin and Vimentin were assessed using Western blotting. Compared to PBS + L group: #p < 0.001. Compared to PN + L group: +p < 0.001, ¯p > 0.05. All data are shown as the mean ± SD from three independent experiments

