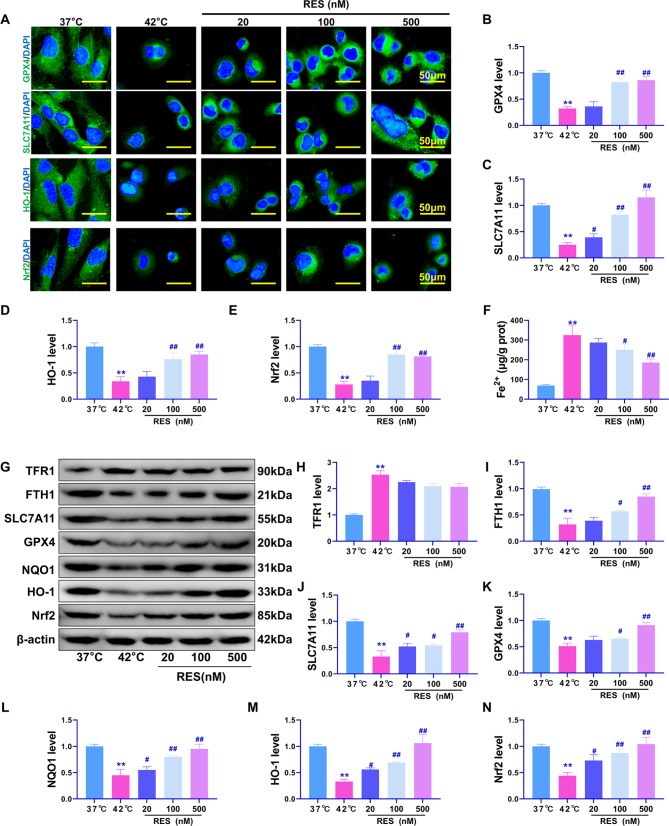
Fig. 2.
Effect of RES treatment on heat stress-induced ferroptosis. (A) Immunofluorescence detection of GPX4, SLC7A11, HO-1, and Nrf2 protein expression and distribution. (B-E) Quantitative statistical results of immunofluorescent protein intensity. (F) Detection of intracellular Fe2+ content. (G) Western blotting for relative expression levels of the TFR1, FTH1, GPX4, SLC7A11, HO-1, NQO1, and Nrf2 proteins. (H–N) Quantitative statistical results of the optical density values of western blotted protein bands. **P < 0.01, *P < 0.05, compared with the 37 °C group; ##P < 0.01, #P < 0.05, compared with the 42 °C group, with statistically significant differences

