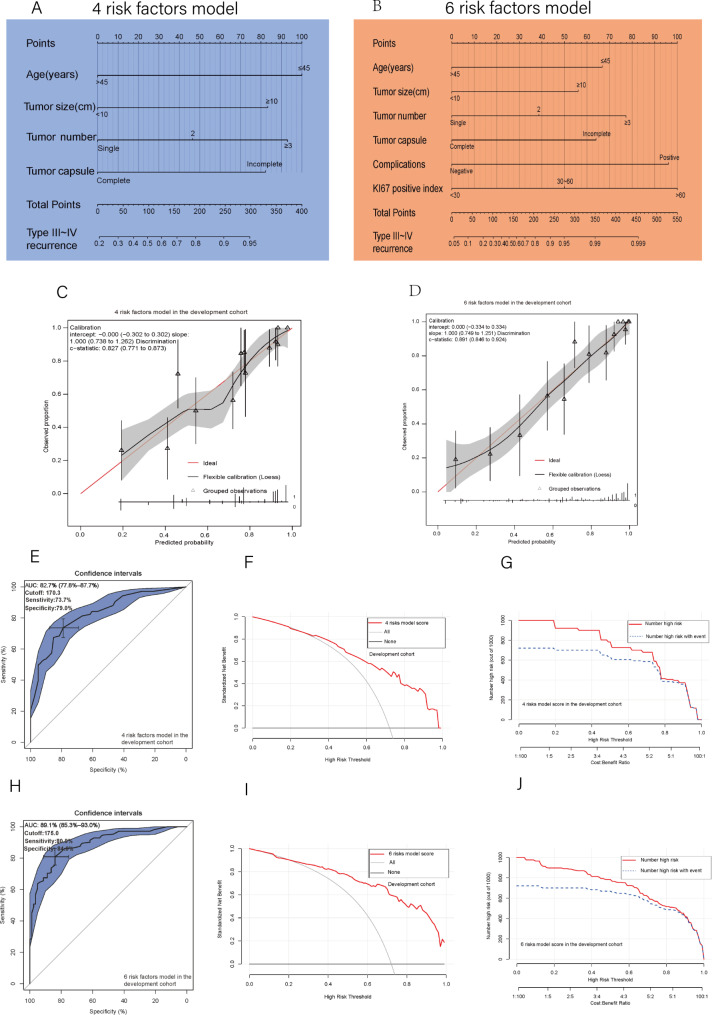
Fig. 2.
(A, B) The 4 risk factor and 6 risk factor nomograms; (C, D) The 4 and 6 risk factors model’s calibration curve in the development cohort; (E) The 4 risk factors model’s ROC curve, Area under the curve, AUC, and cutoff value in the development cohort; (H) The 6 risk factors model’s ROC curve, Area under the curve, AUC, and cutoff value in the development cohort; (F) The 4 risk factor model’s DCA in the development cohort; (I) The 6 risk factor model’s DCA in the development cohort; (G) The 4 risk factor model’s clinical impact curves in the development cohort; (J) The 6 risk factor model’s clinical impact curves in the development cohort

